tm-vocabulary · paper · online appendix · theme explorer · IPO viewer · code
Supplement to Business Themes in the Trademark Record: Language Signals of Product Survival, Funding, and Listing (SSRN 6954598).
Everything here is computed on the same corpus and the same per-filing reference windows as the paper. The paper reports pooled estimates because they are what the design identifies cleanly; this appendix reports the class level because the pooled numbers average over real and large industry variation, and a reader who cares about one industry should be able to see it.
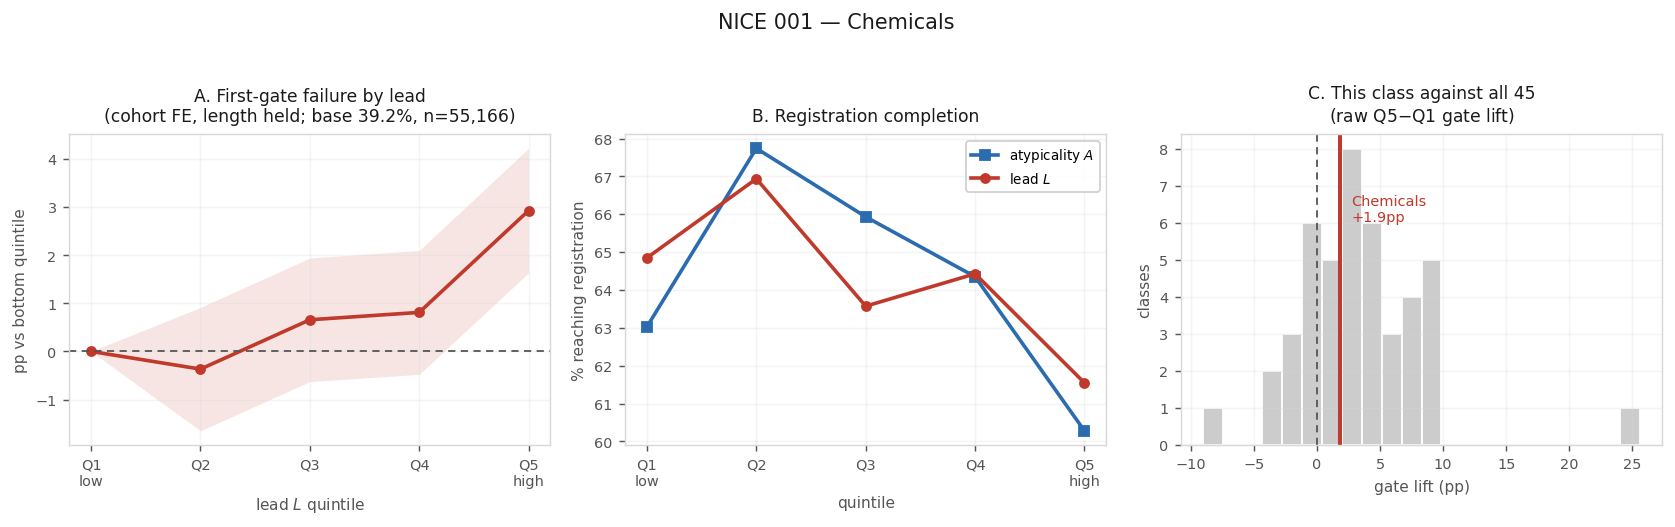
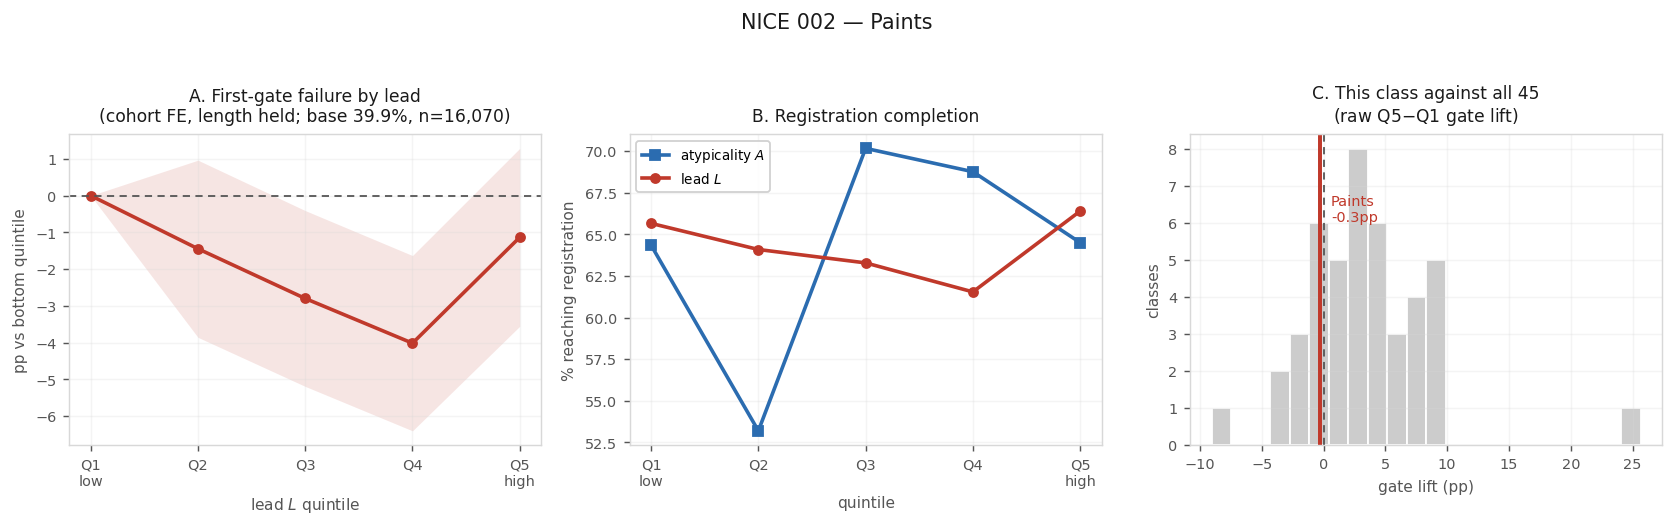
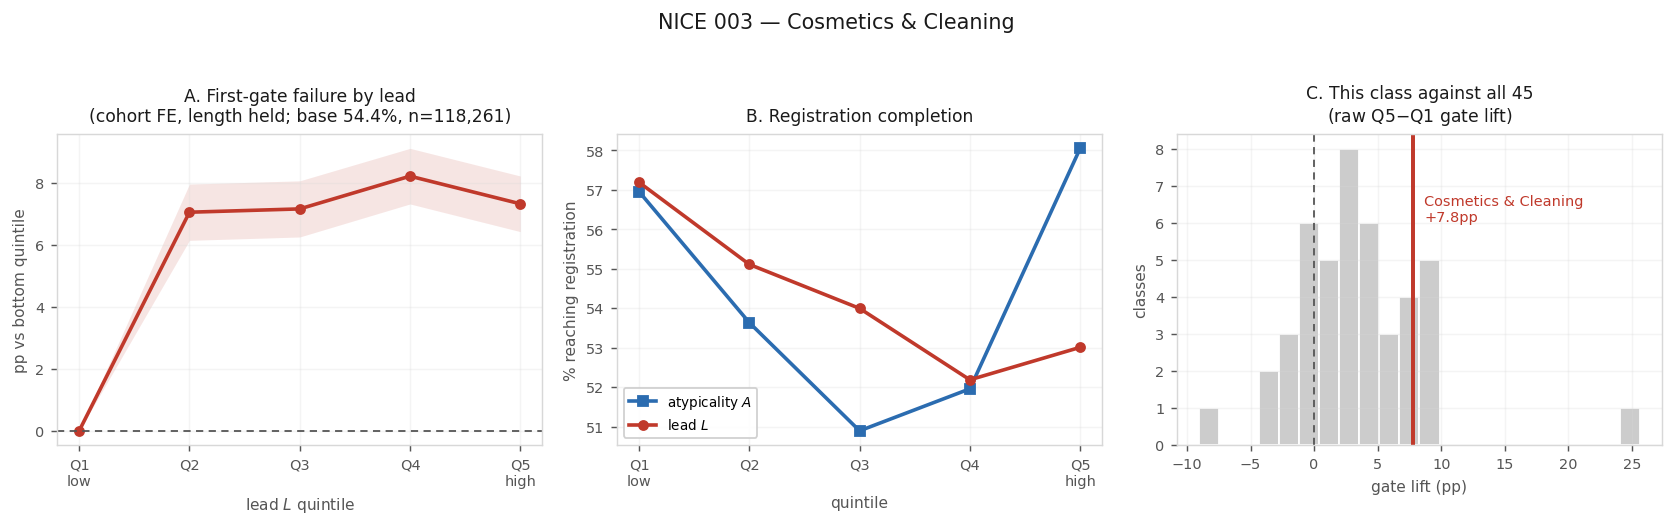
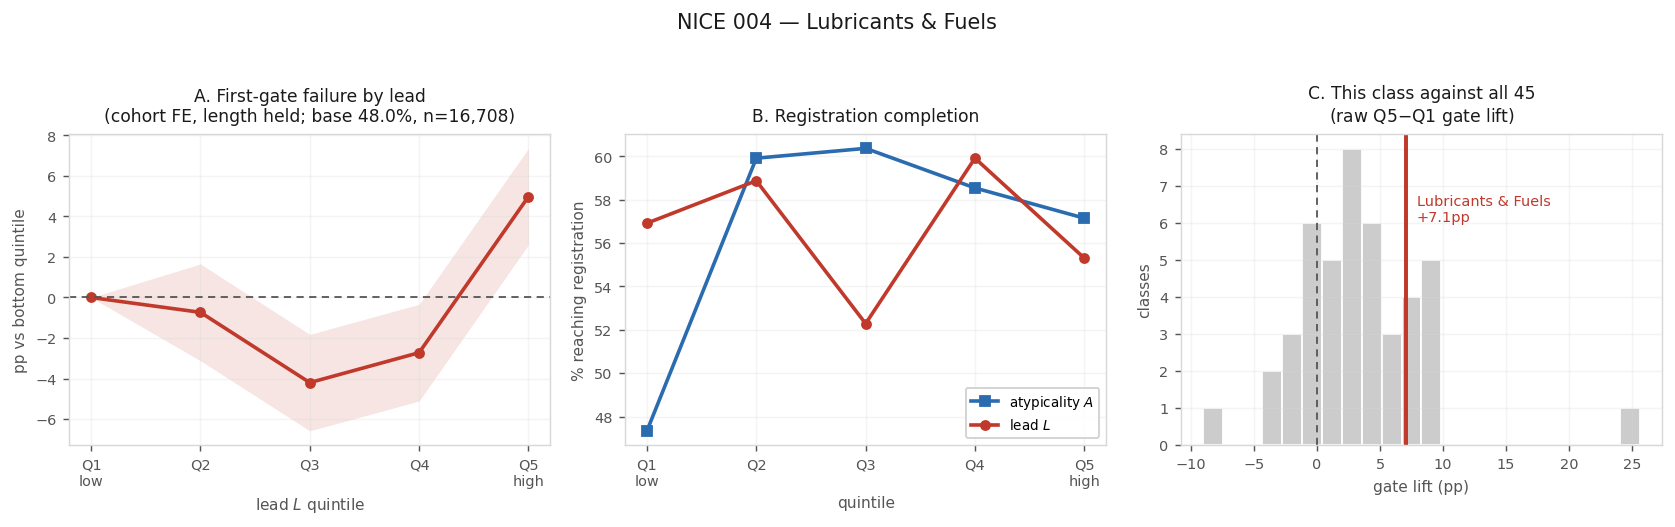
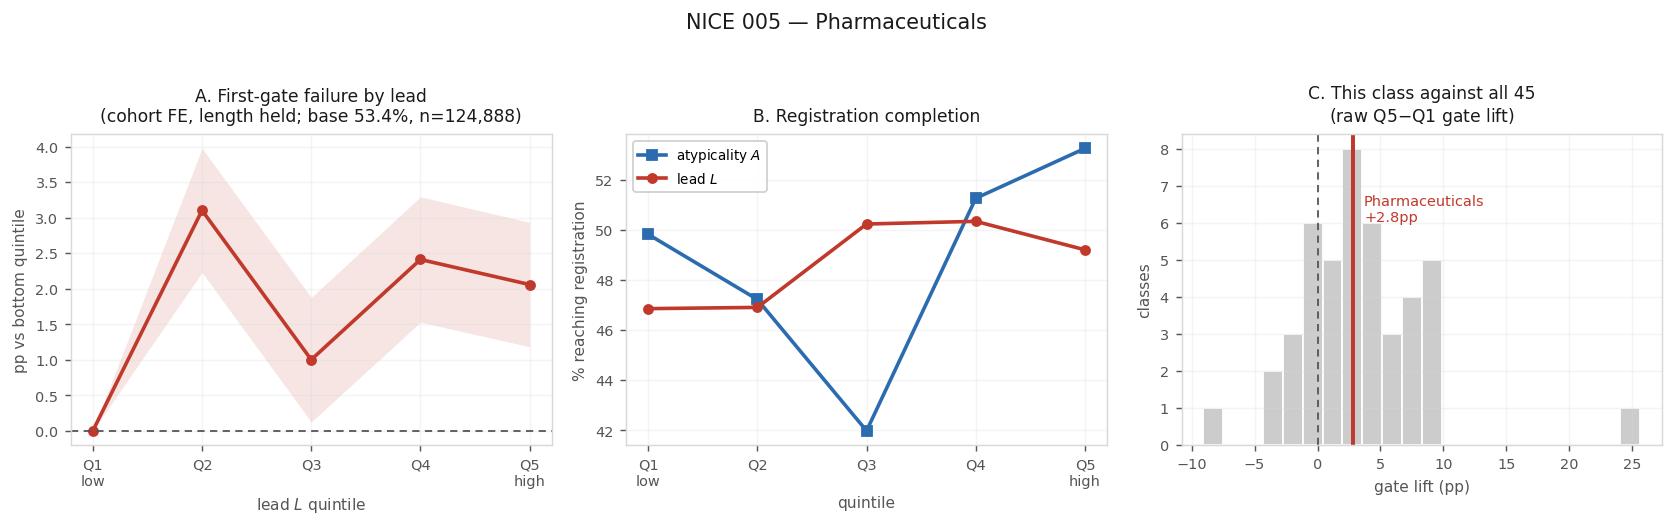
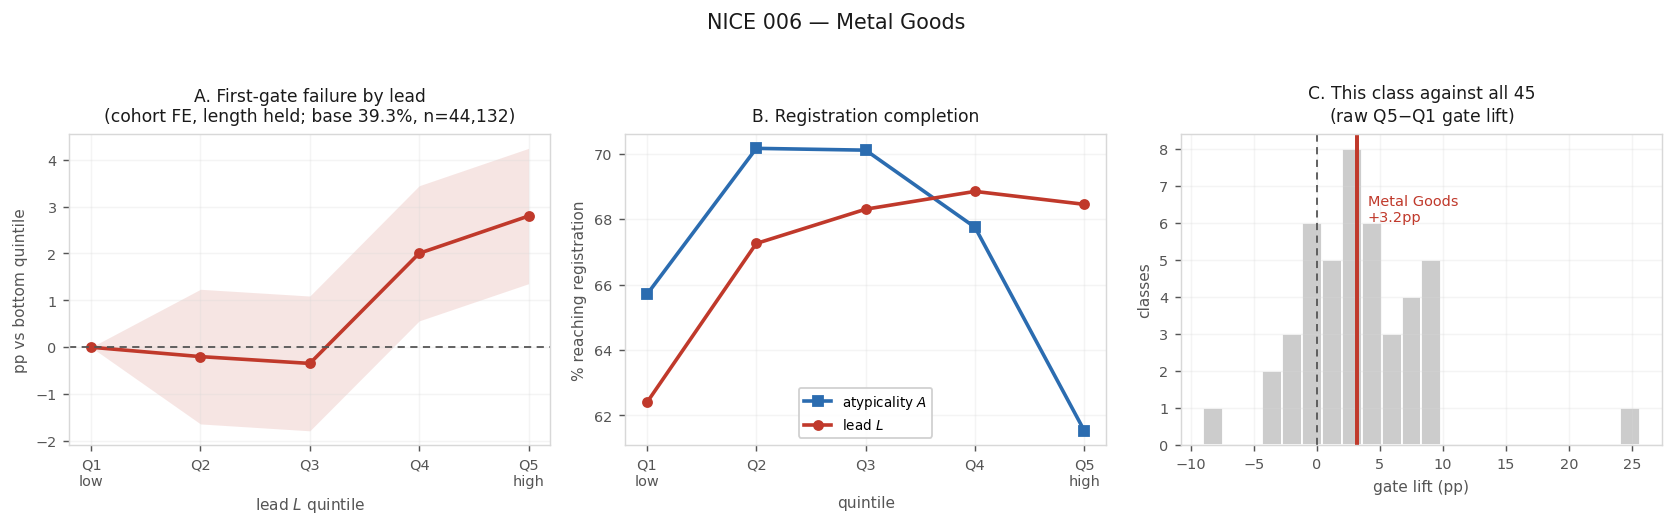
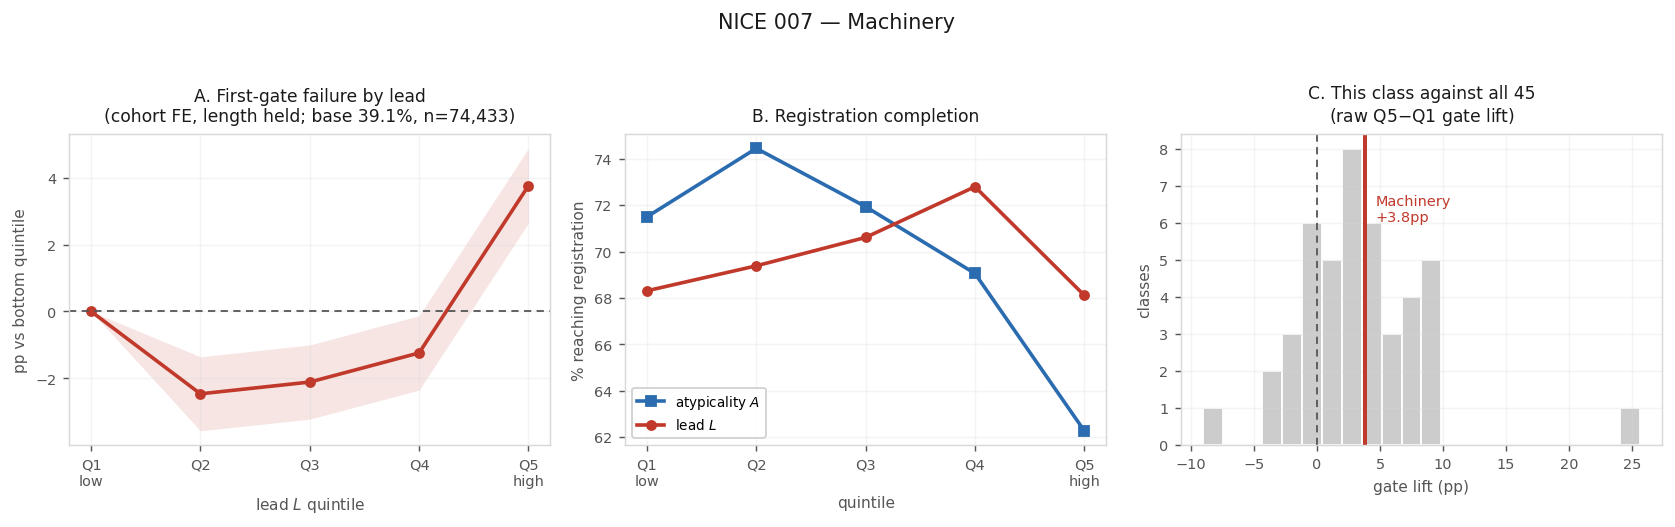
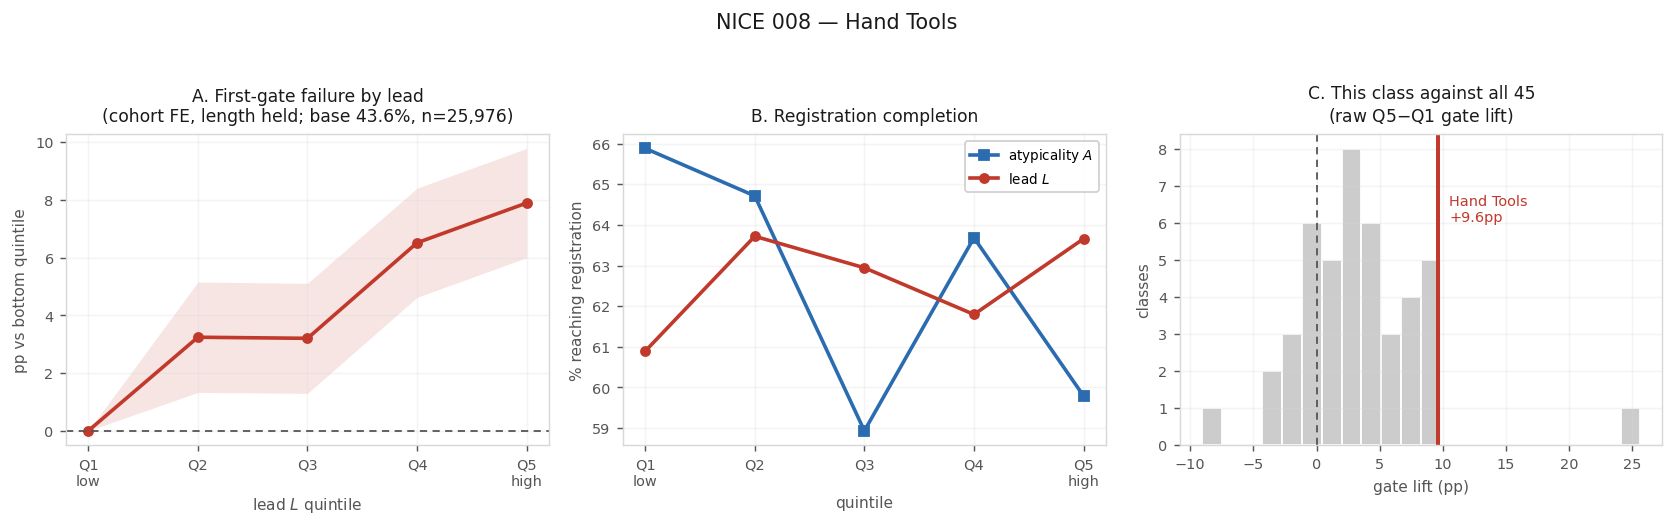
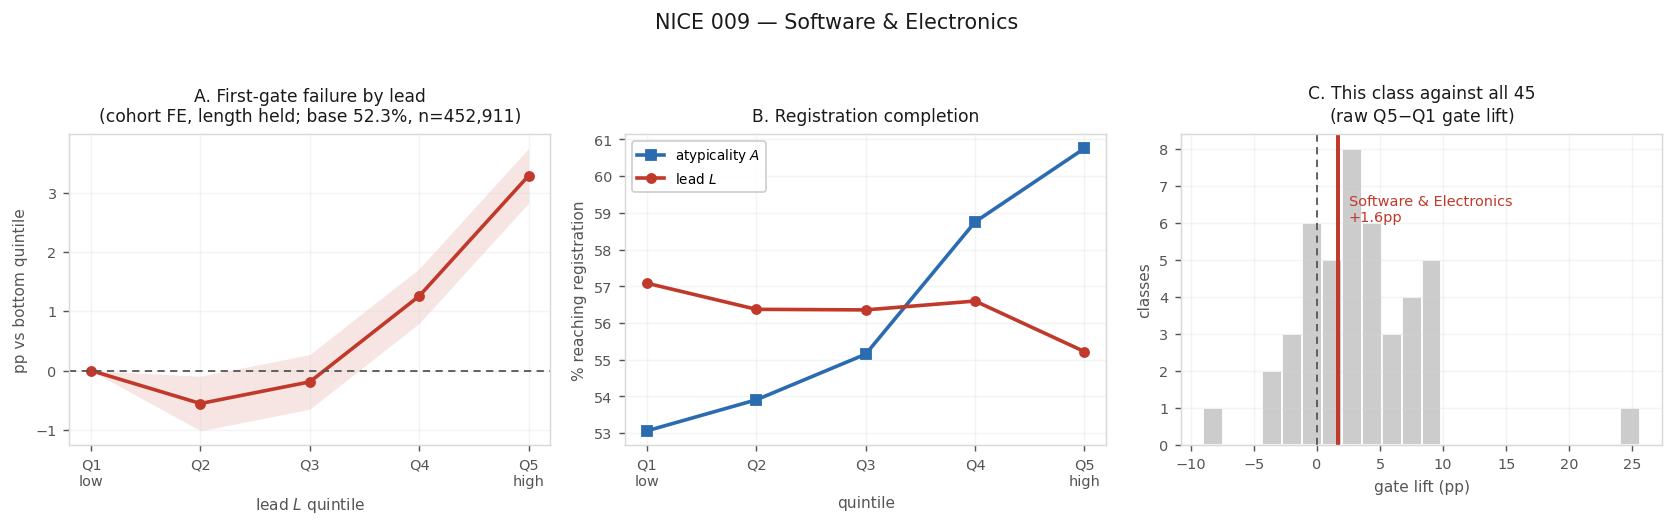
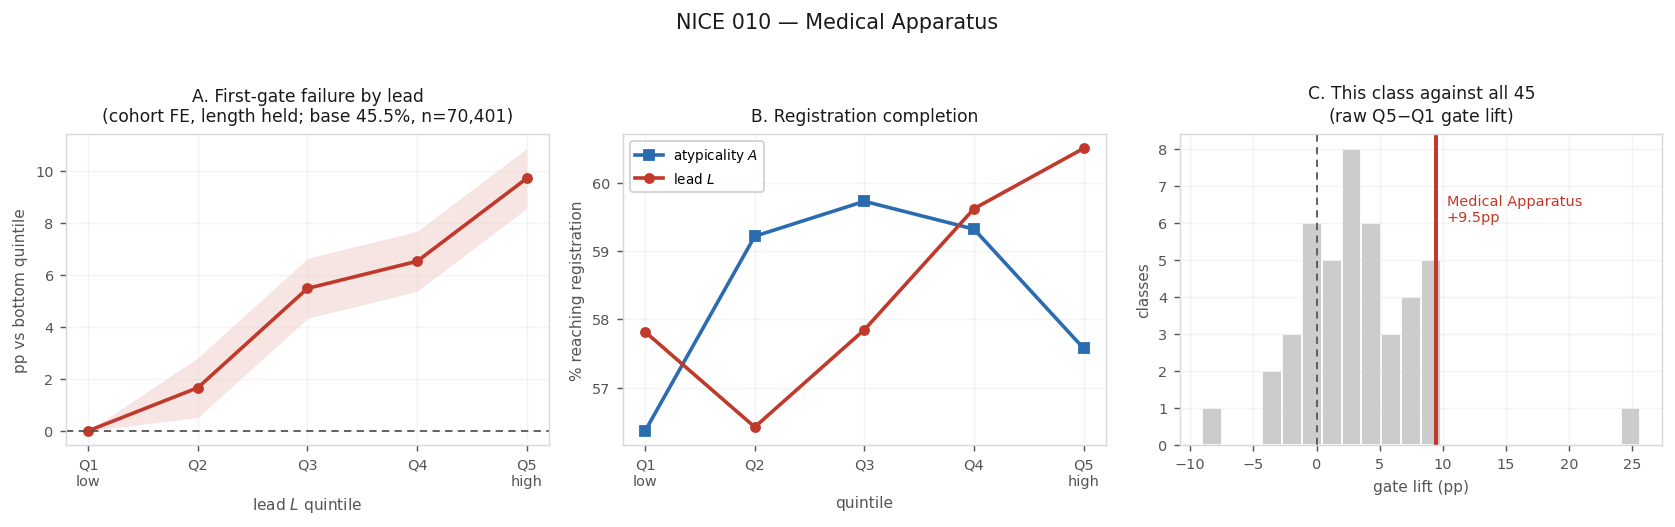
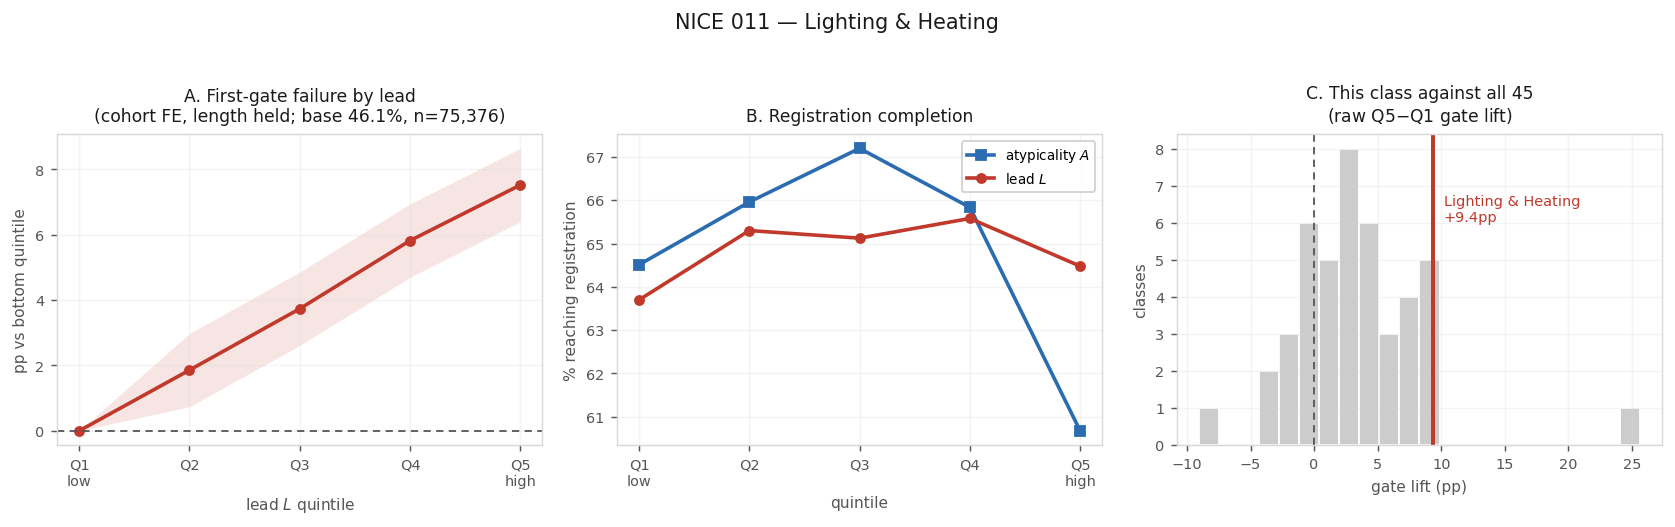
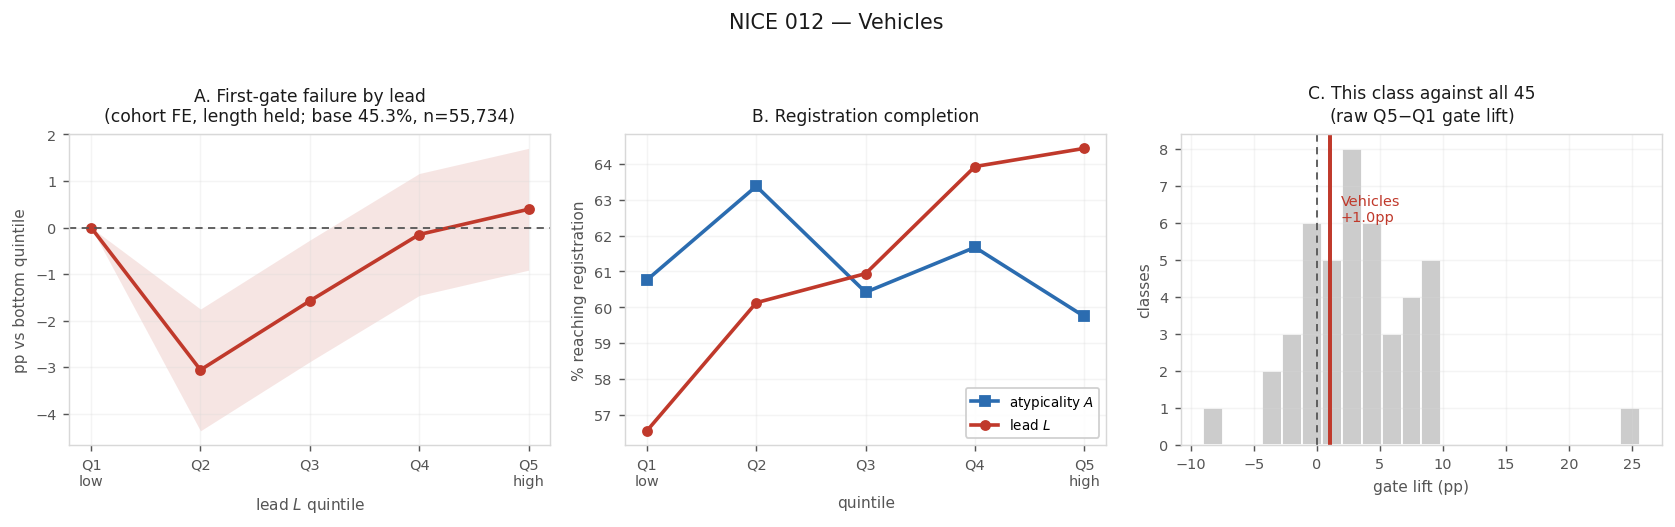
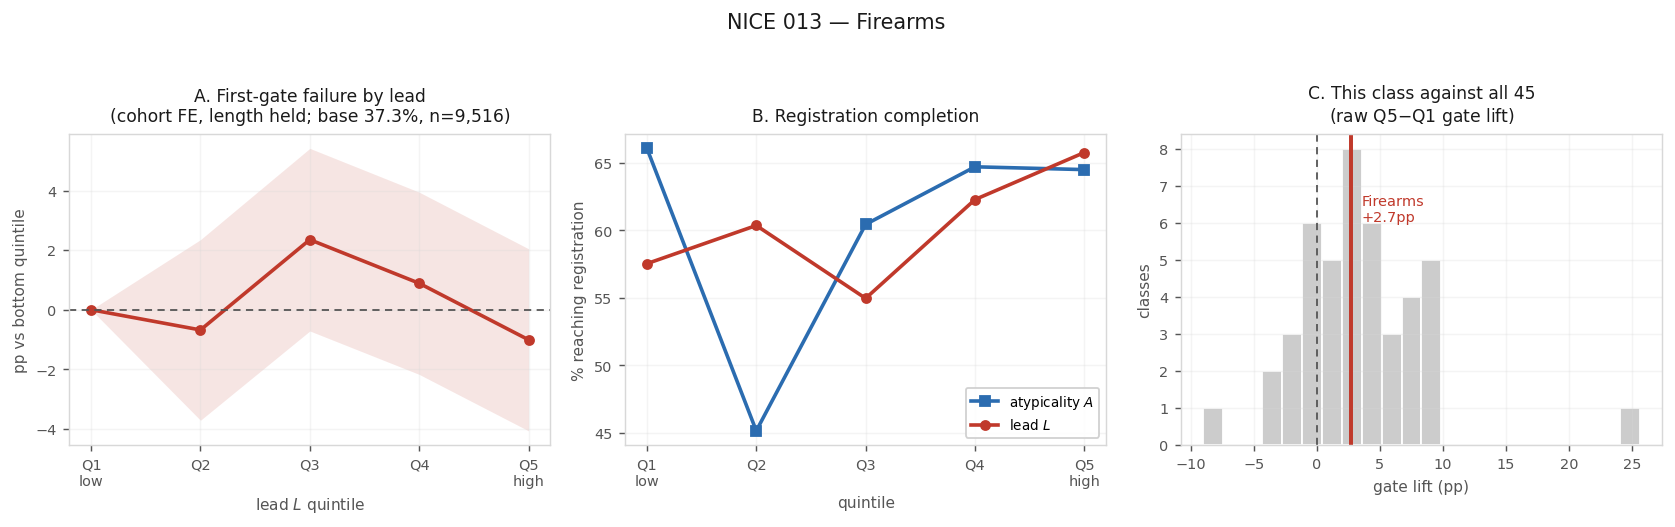
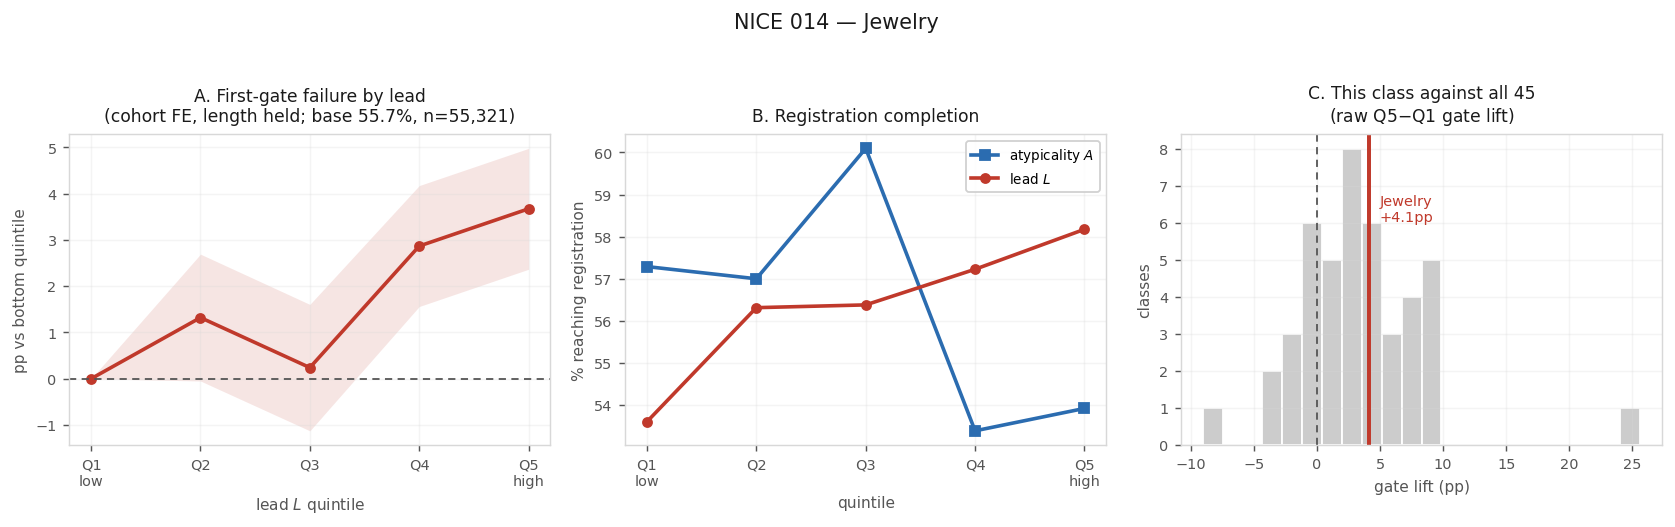
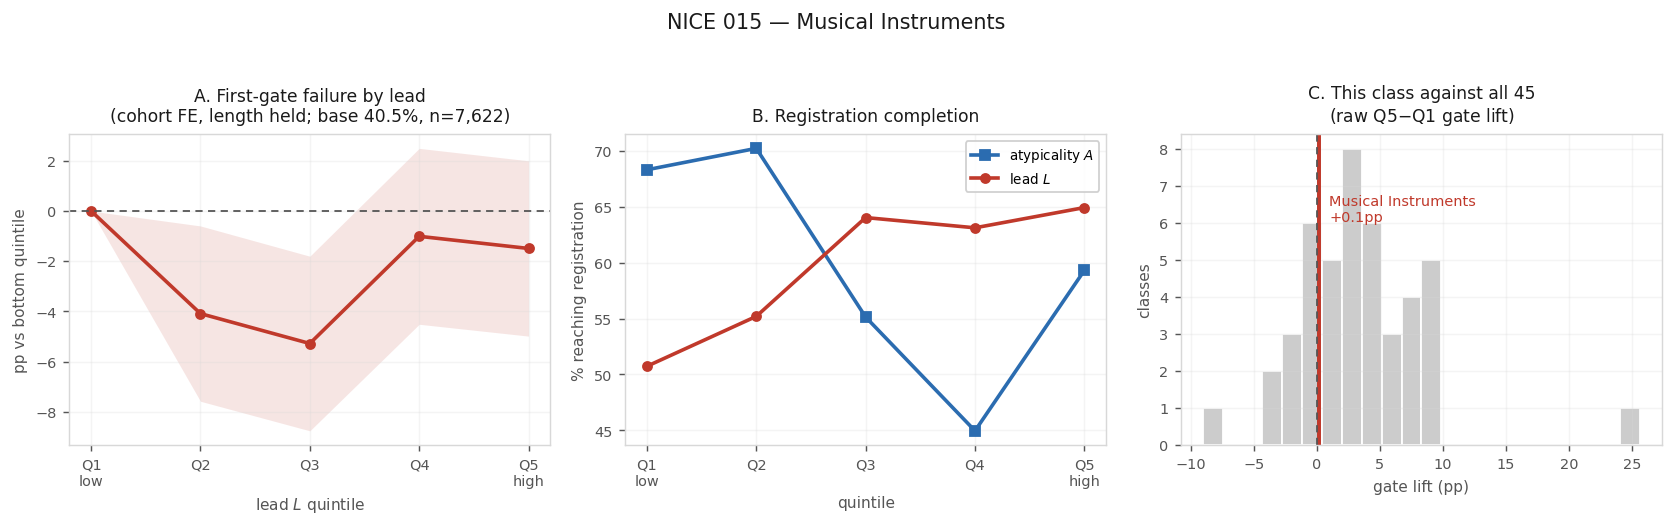
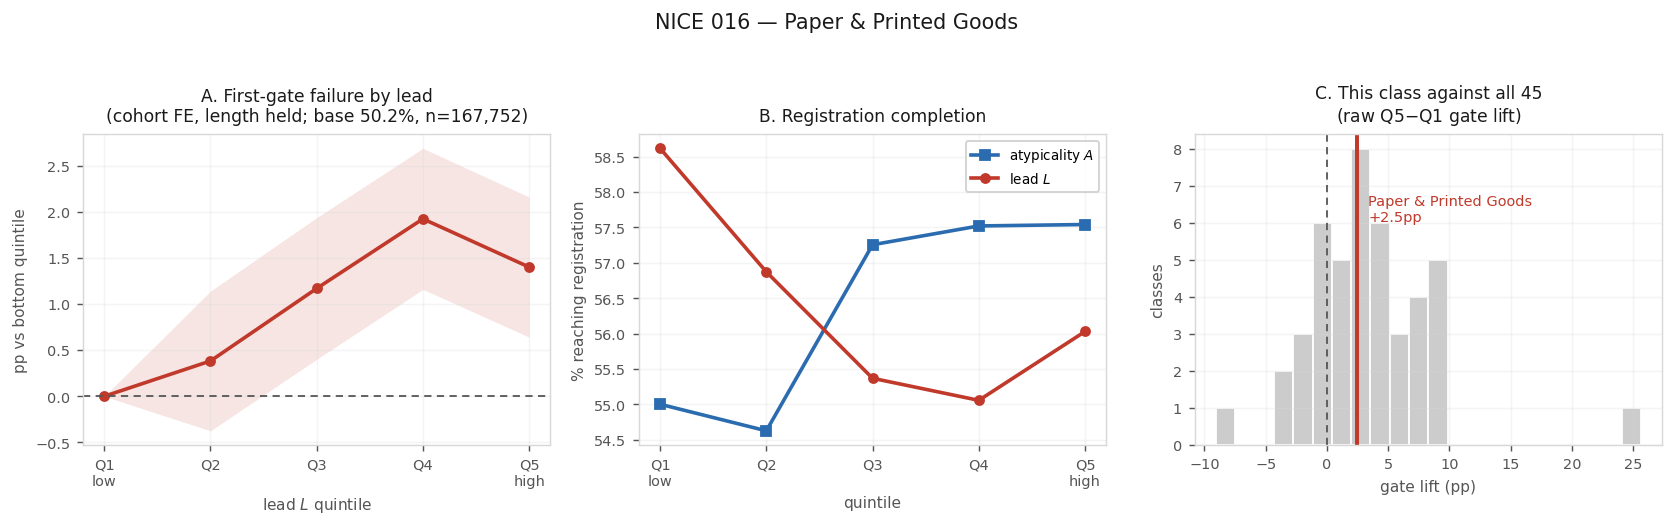
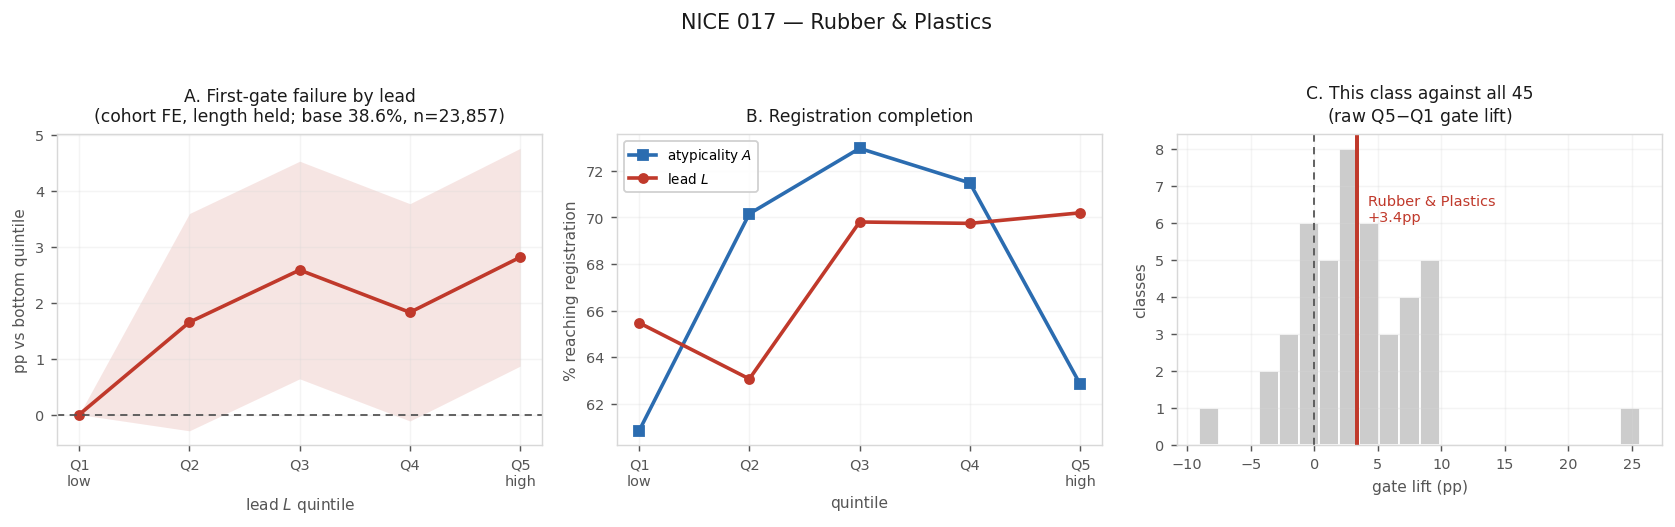
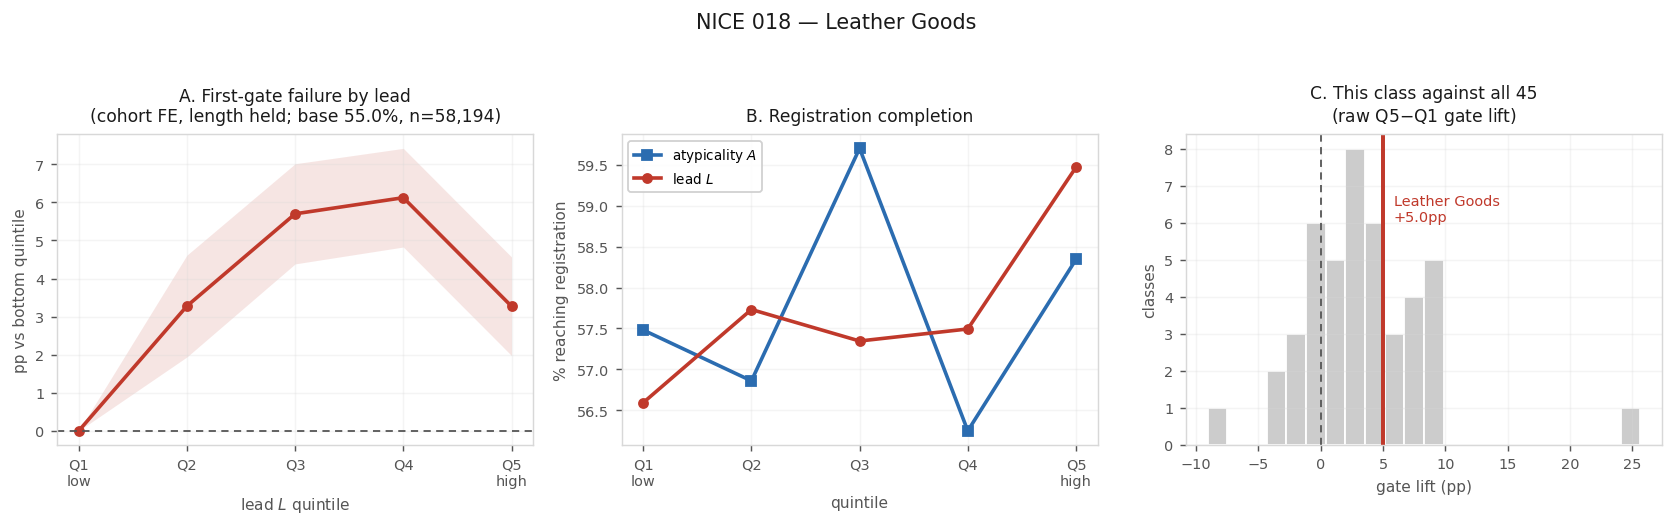
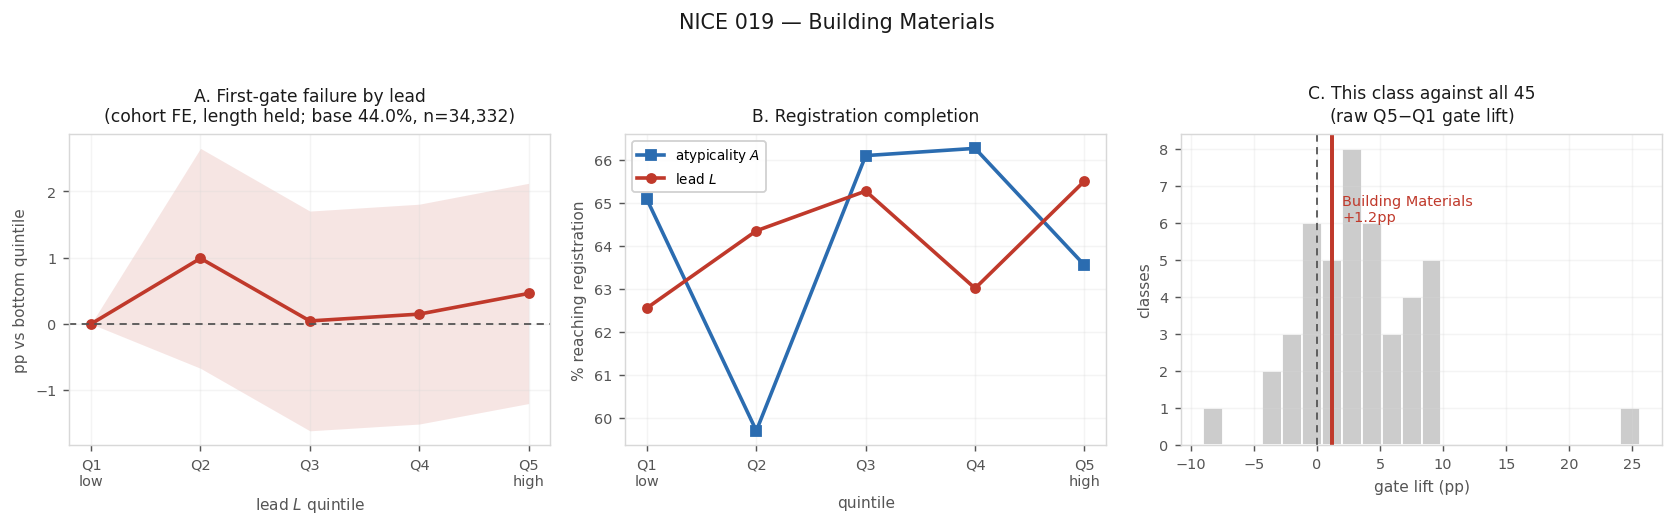
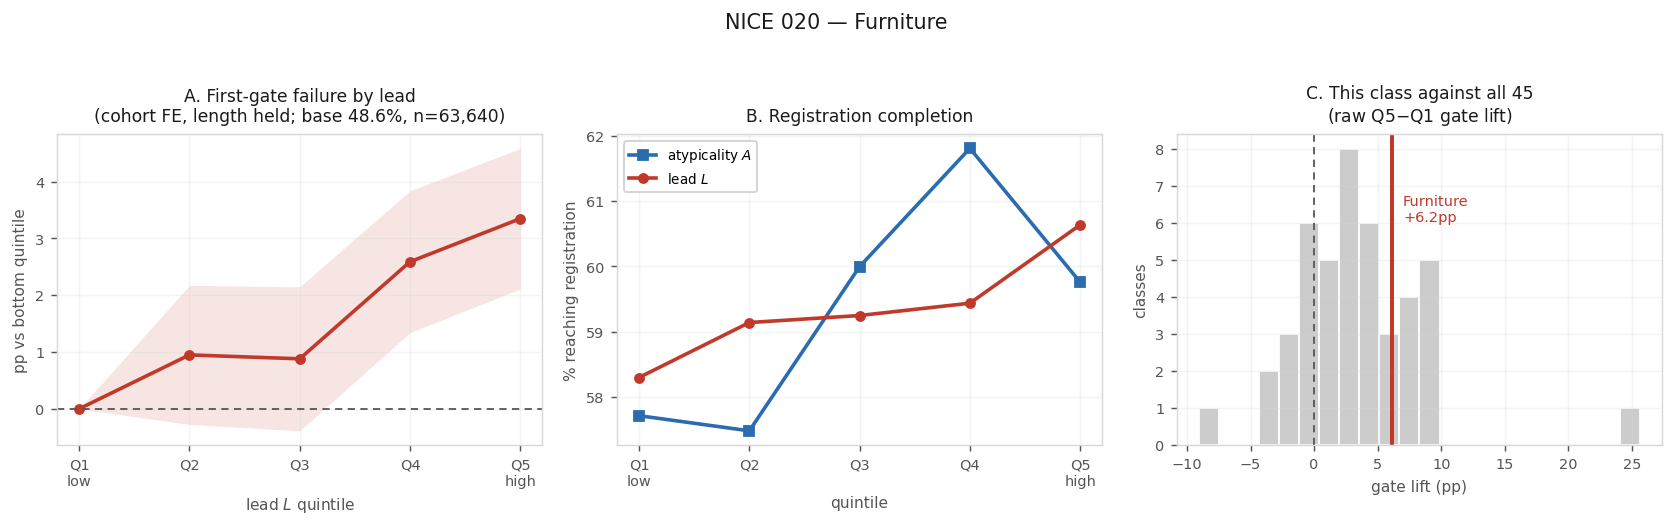
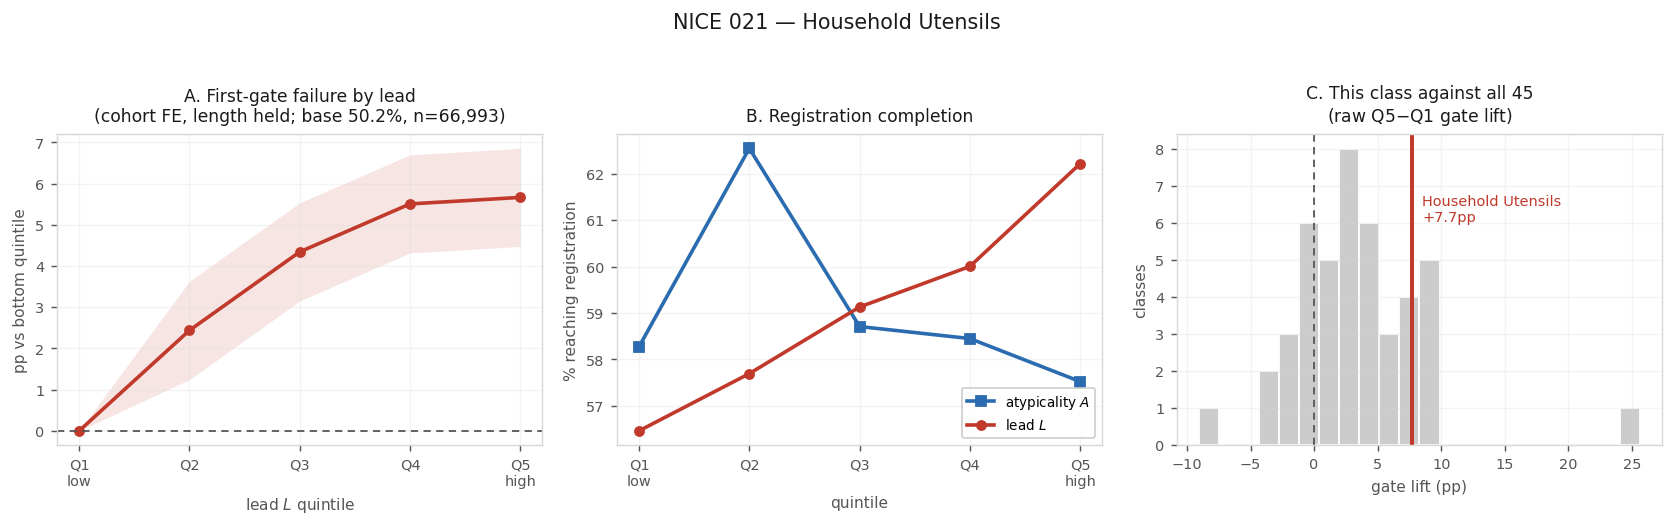
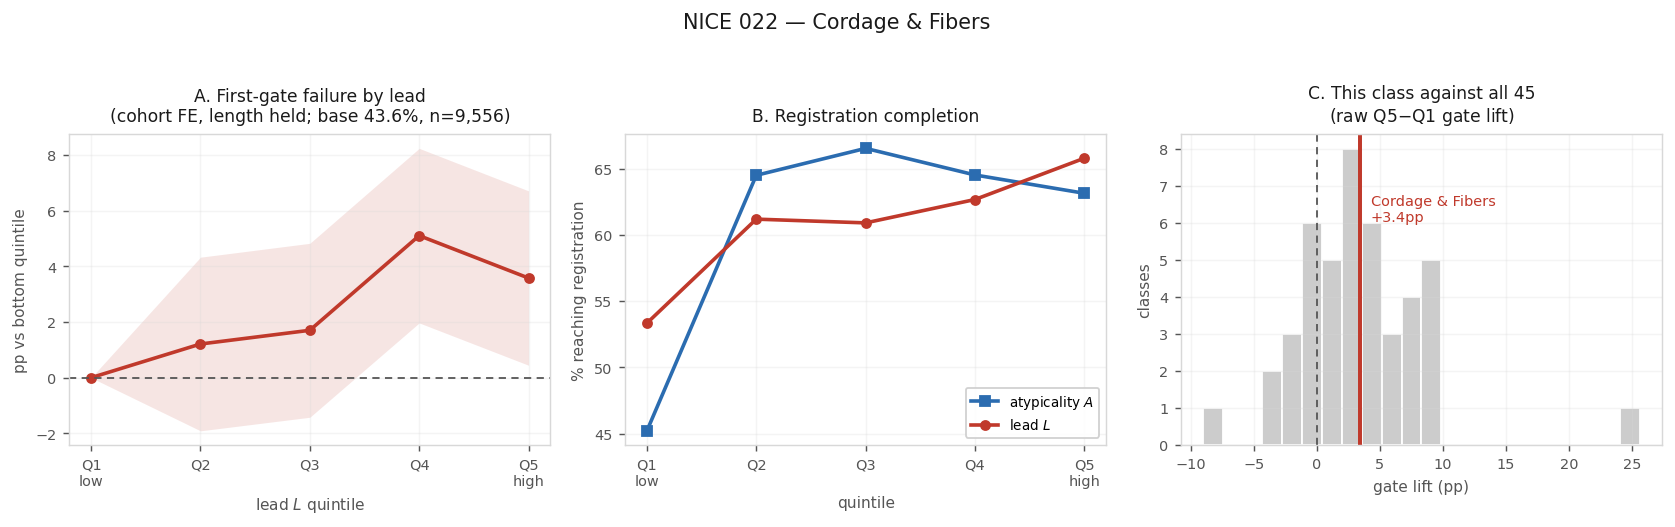
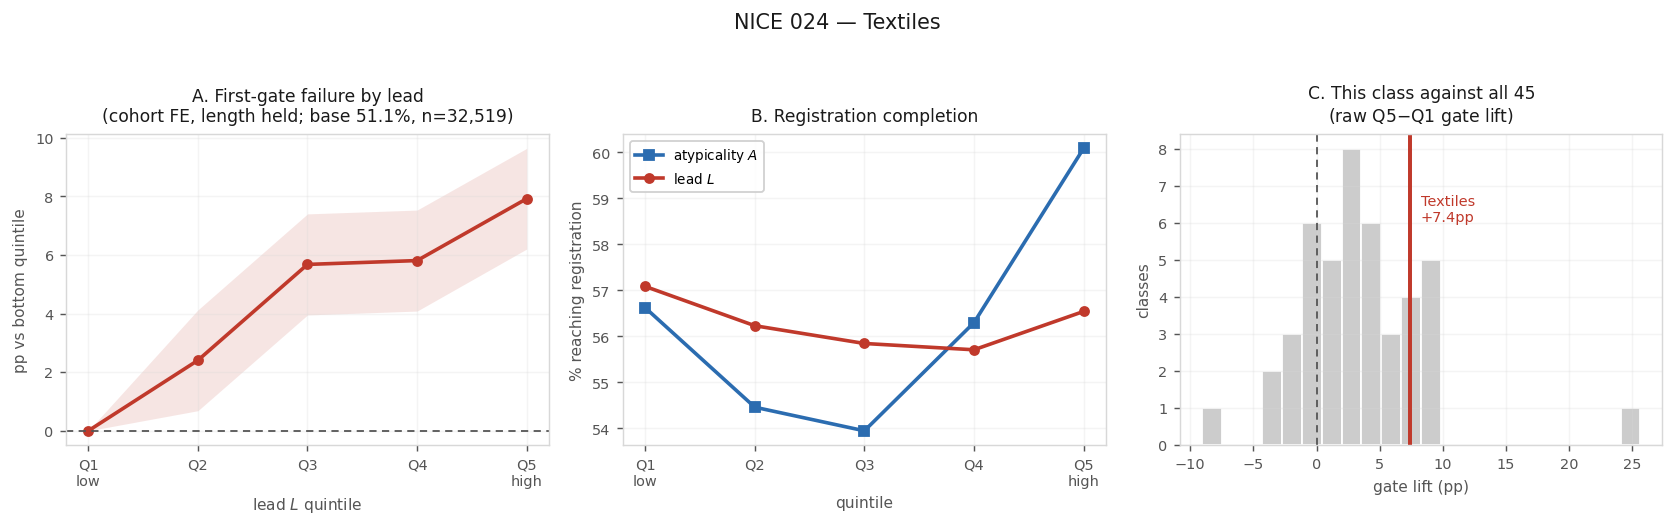
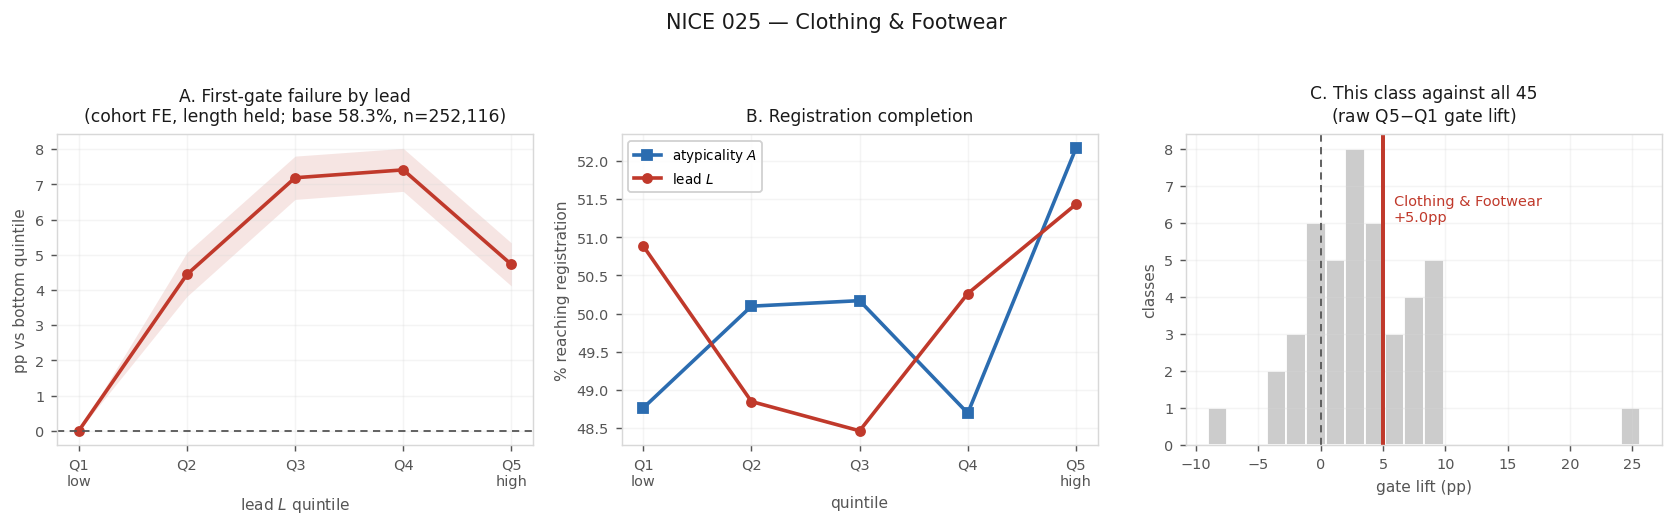
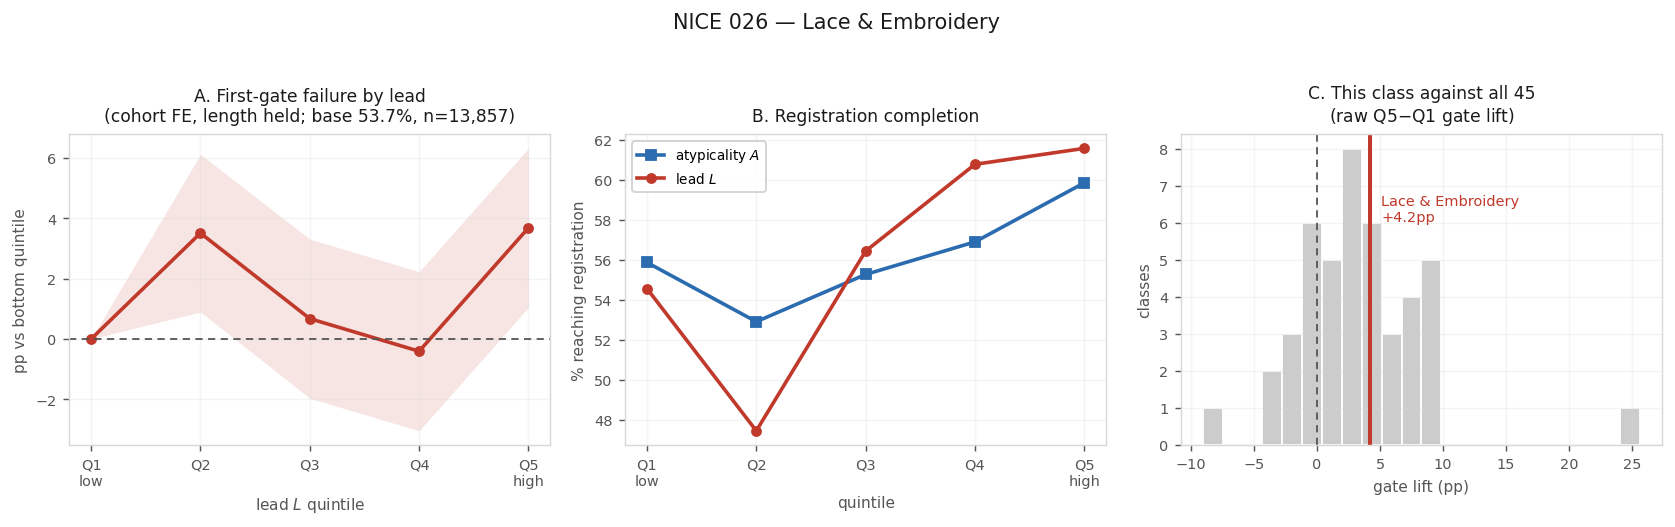
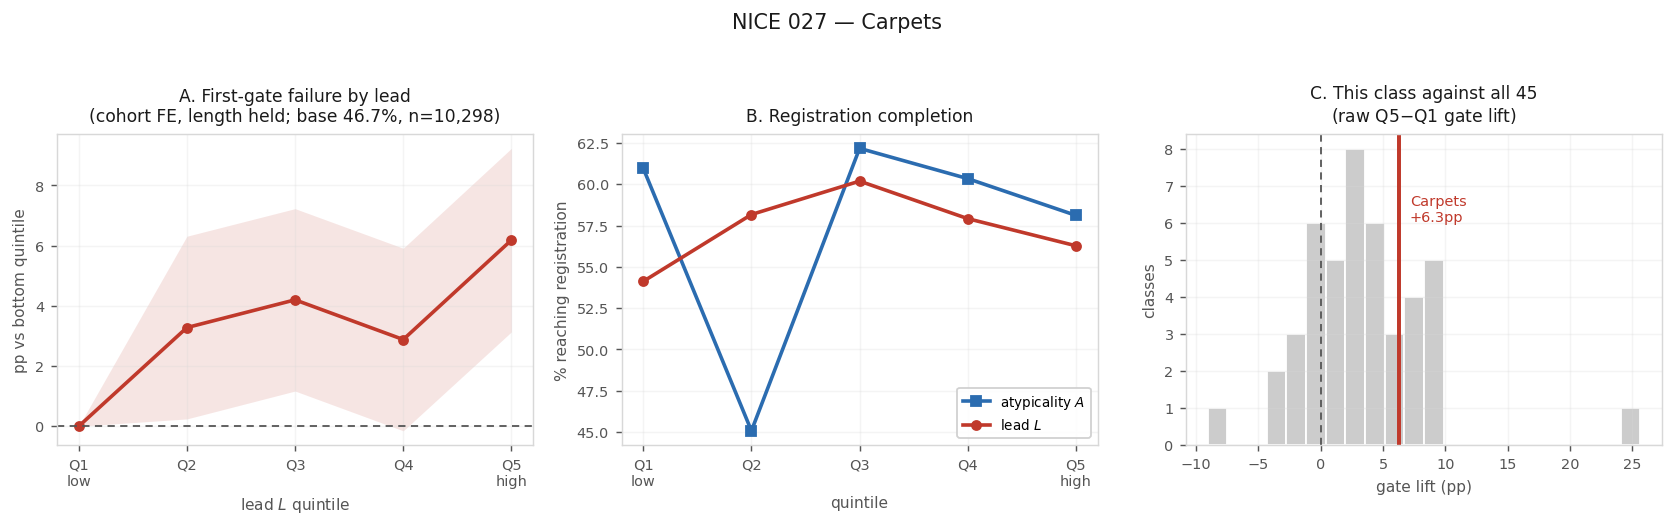
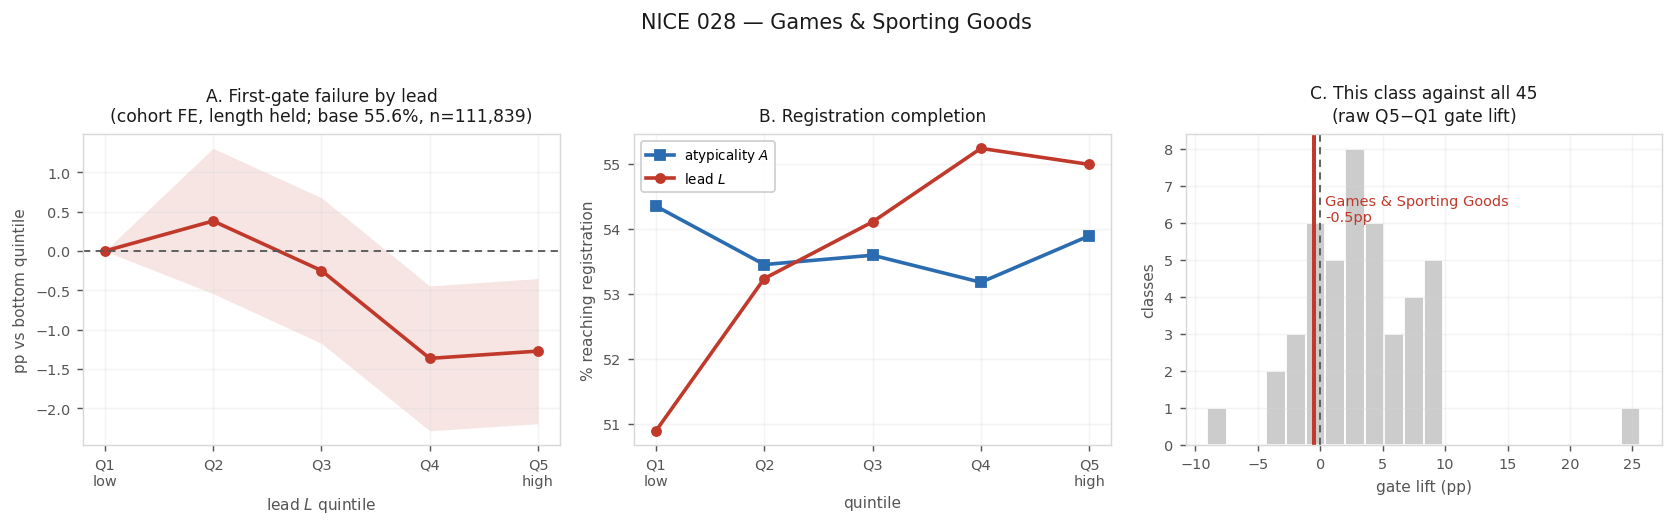
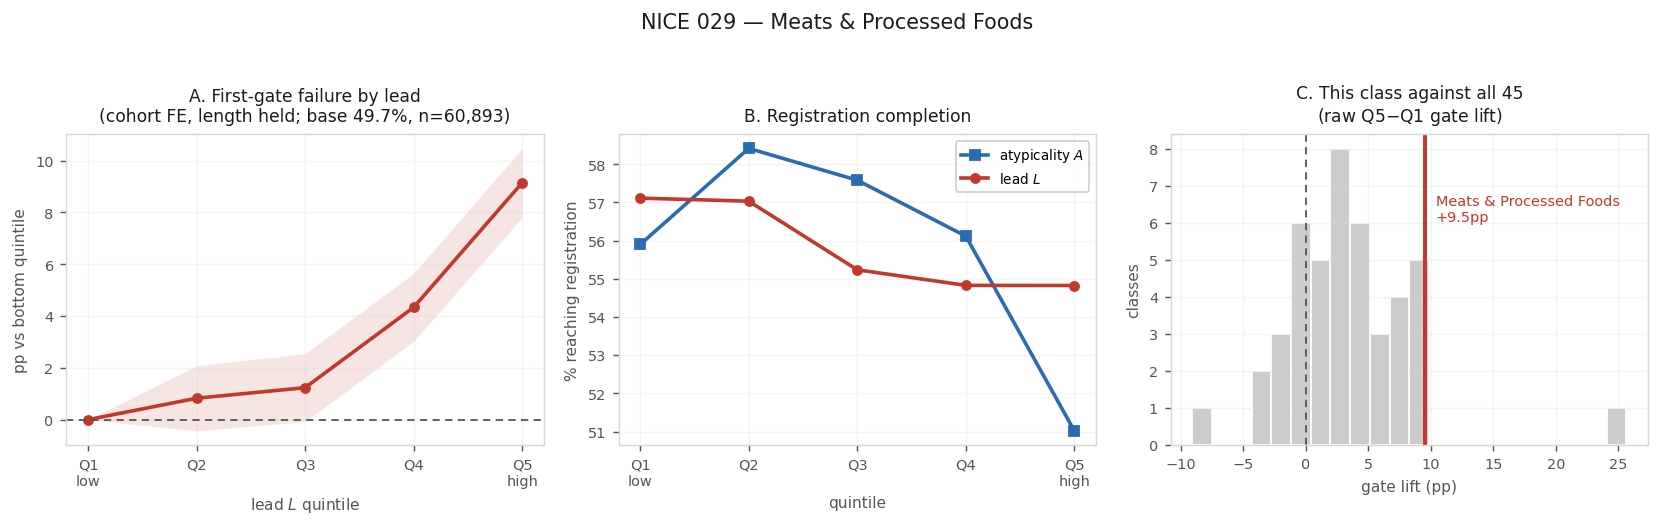
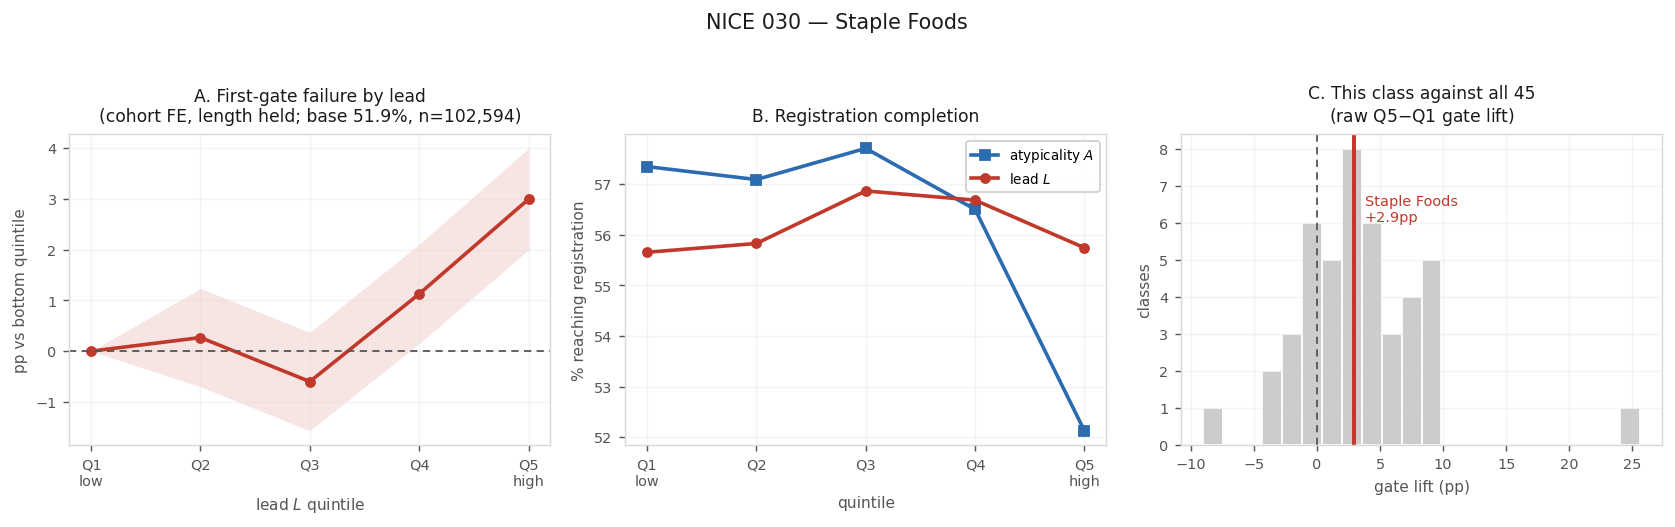
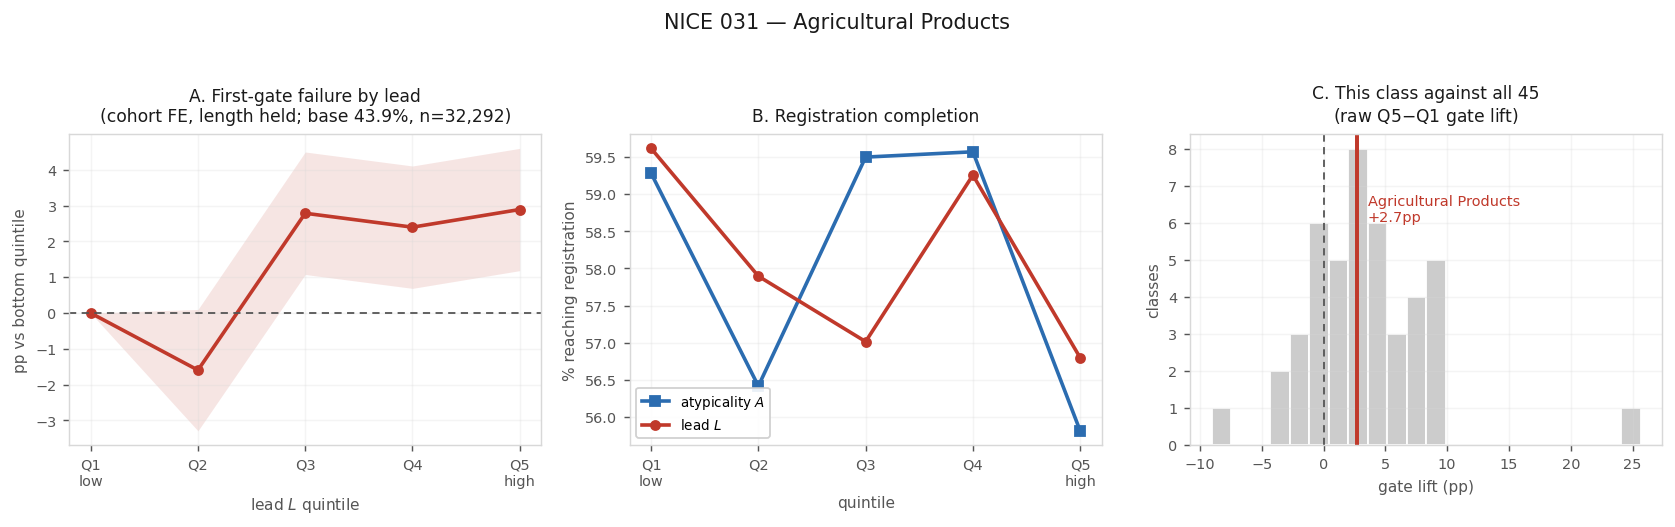
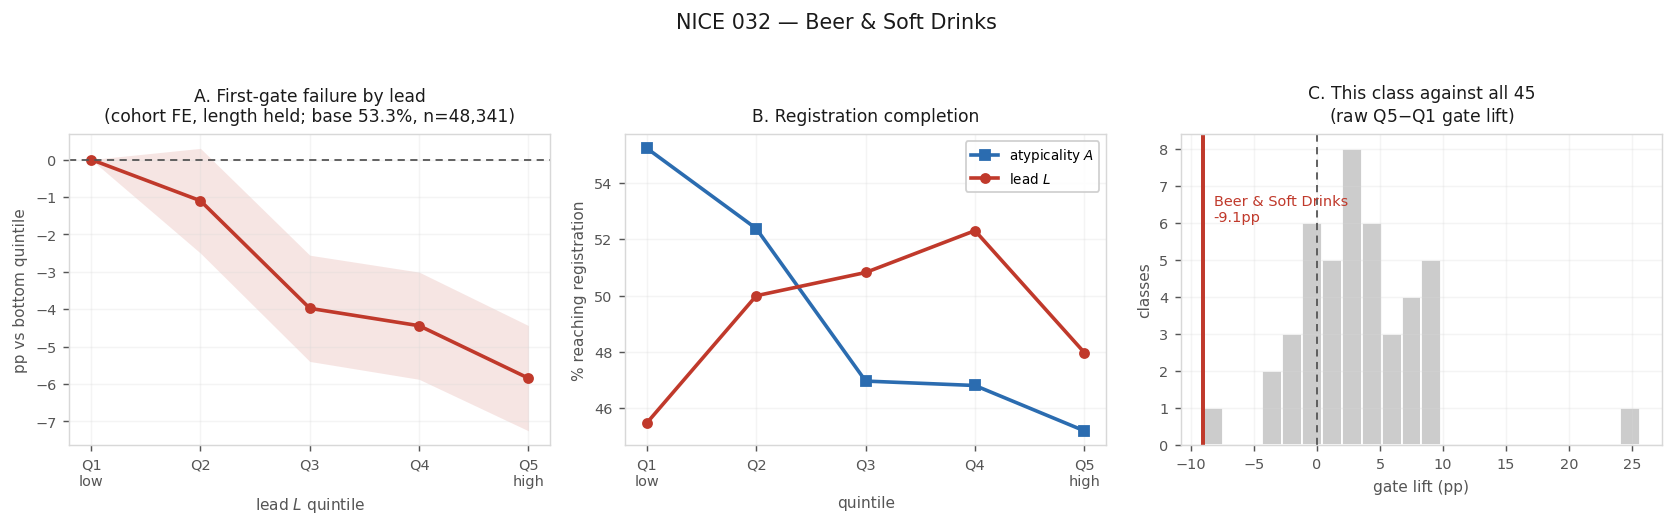
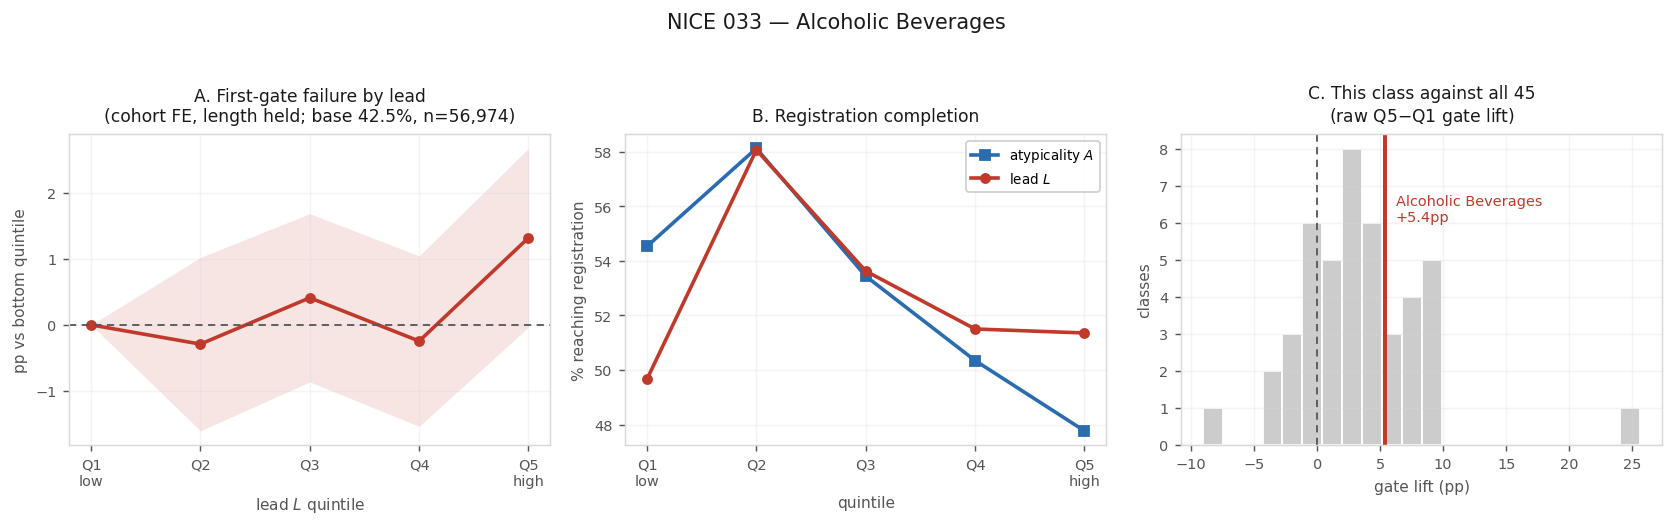
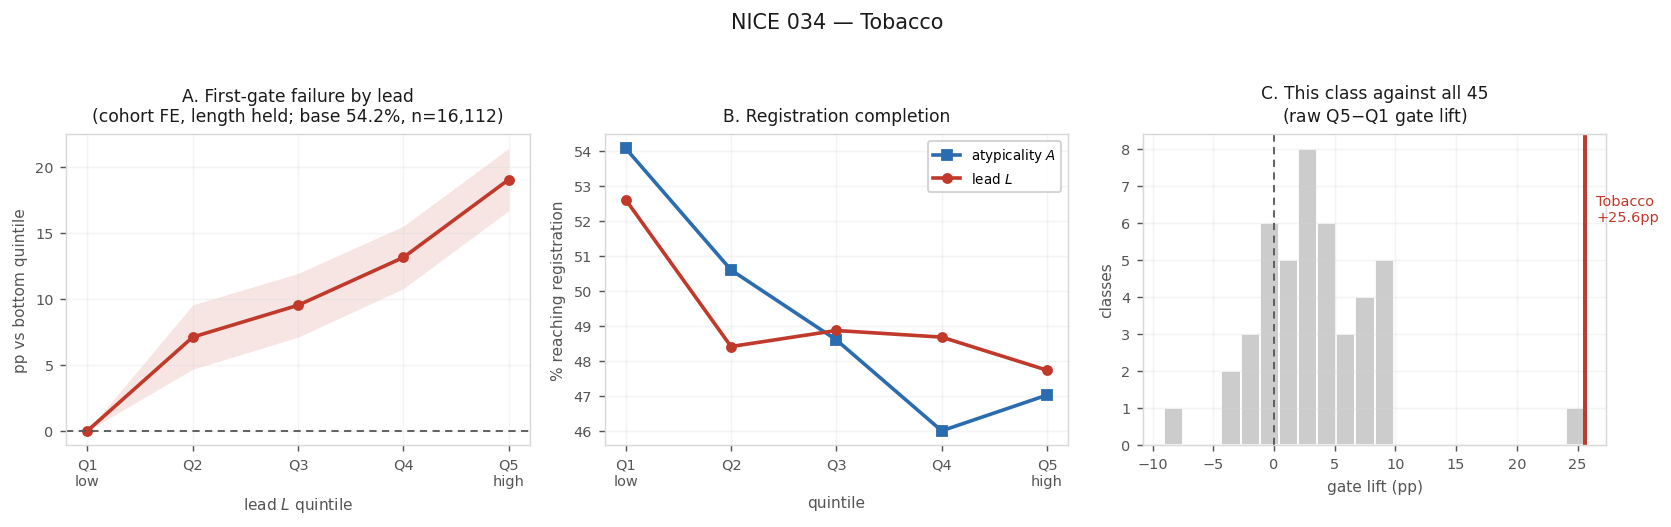
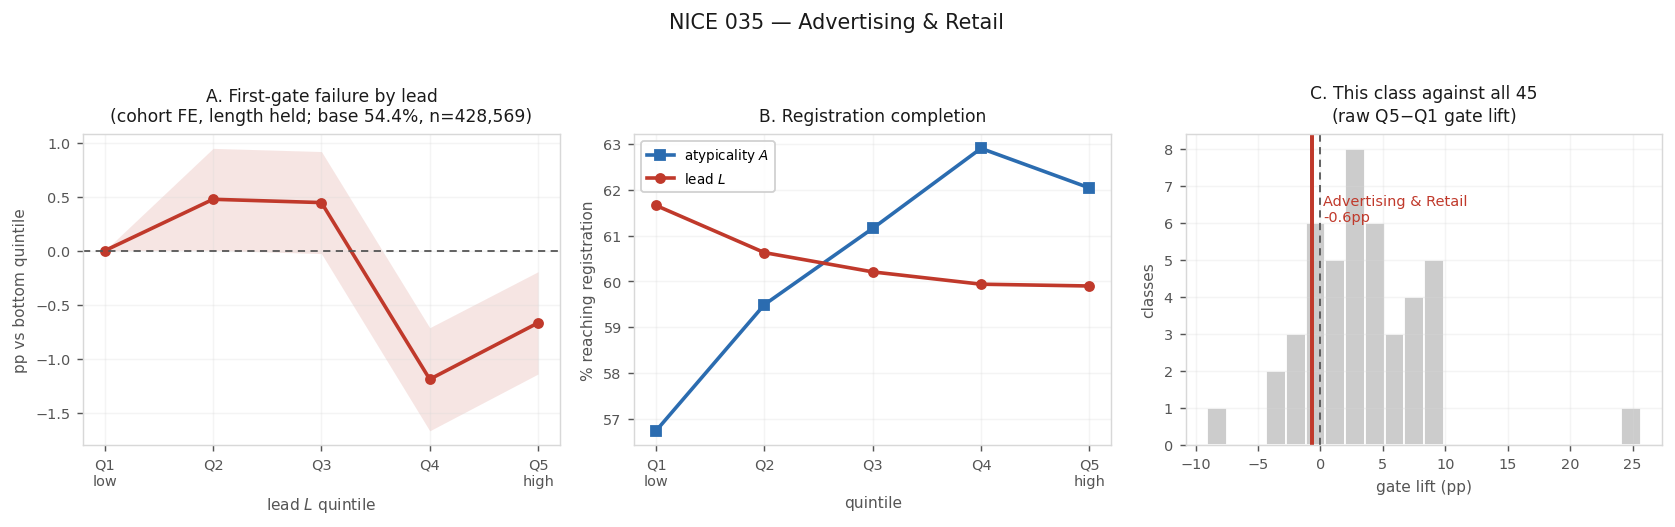
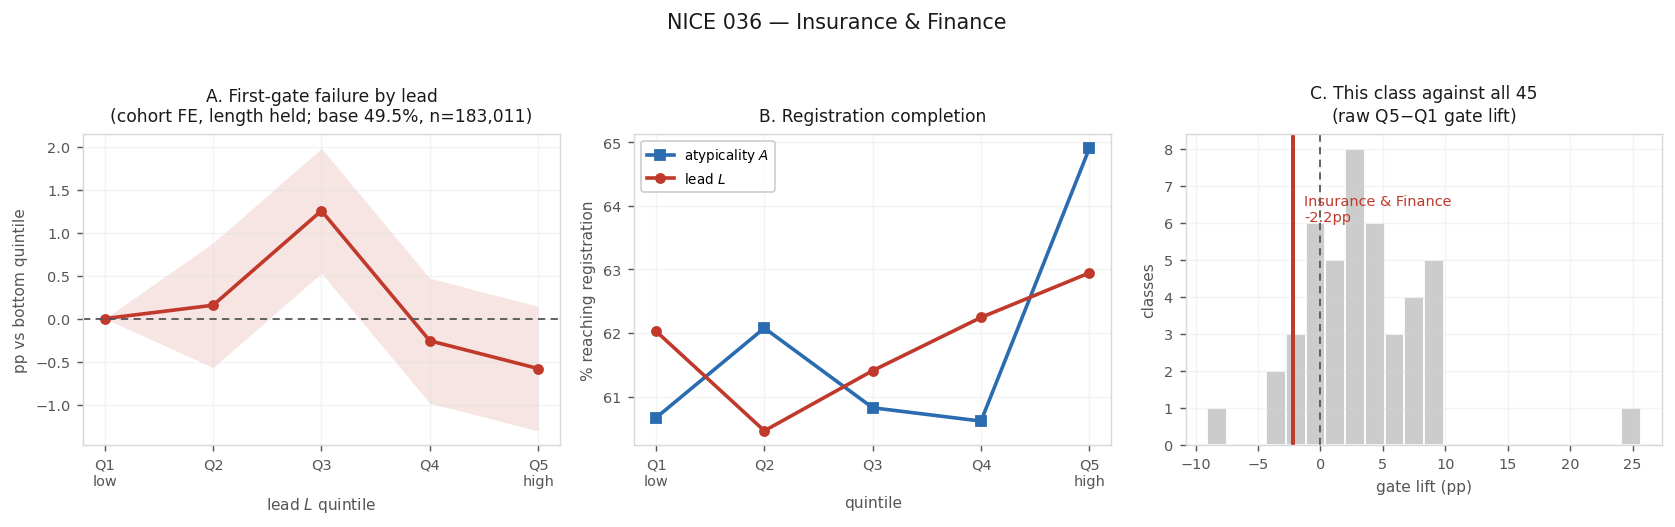
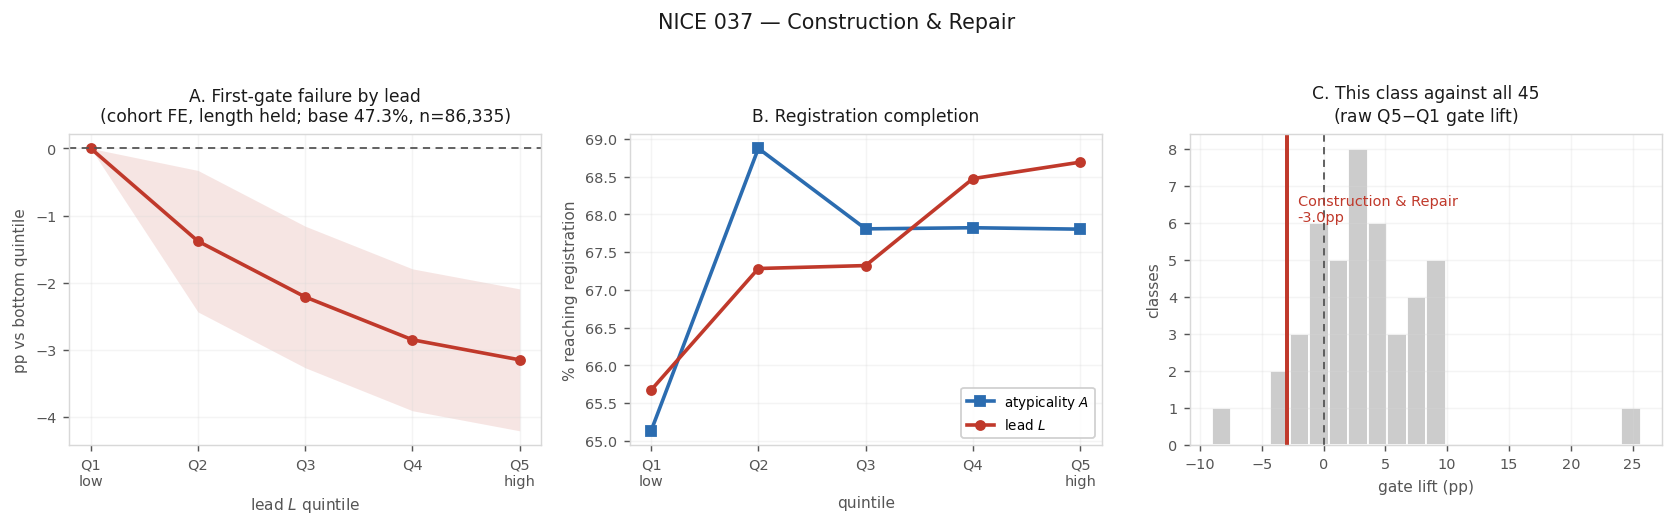
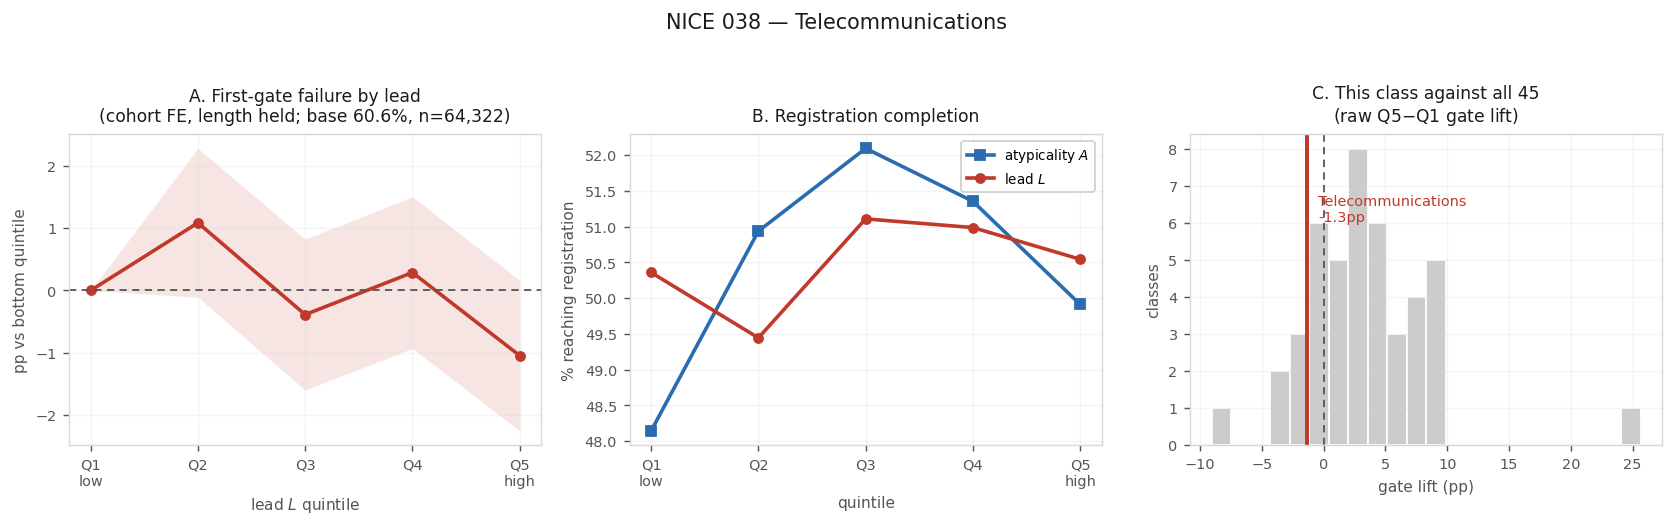
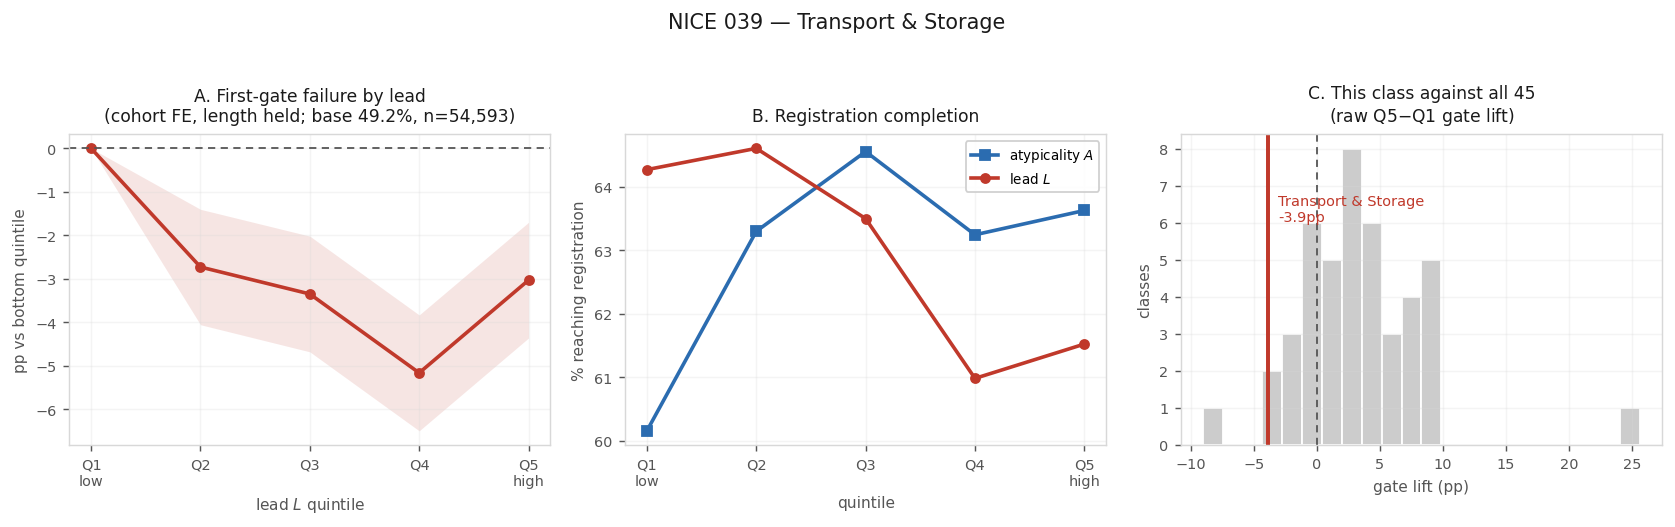
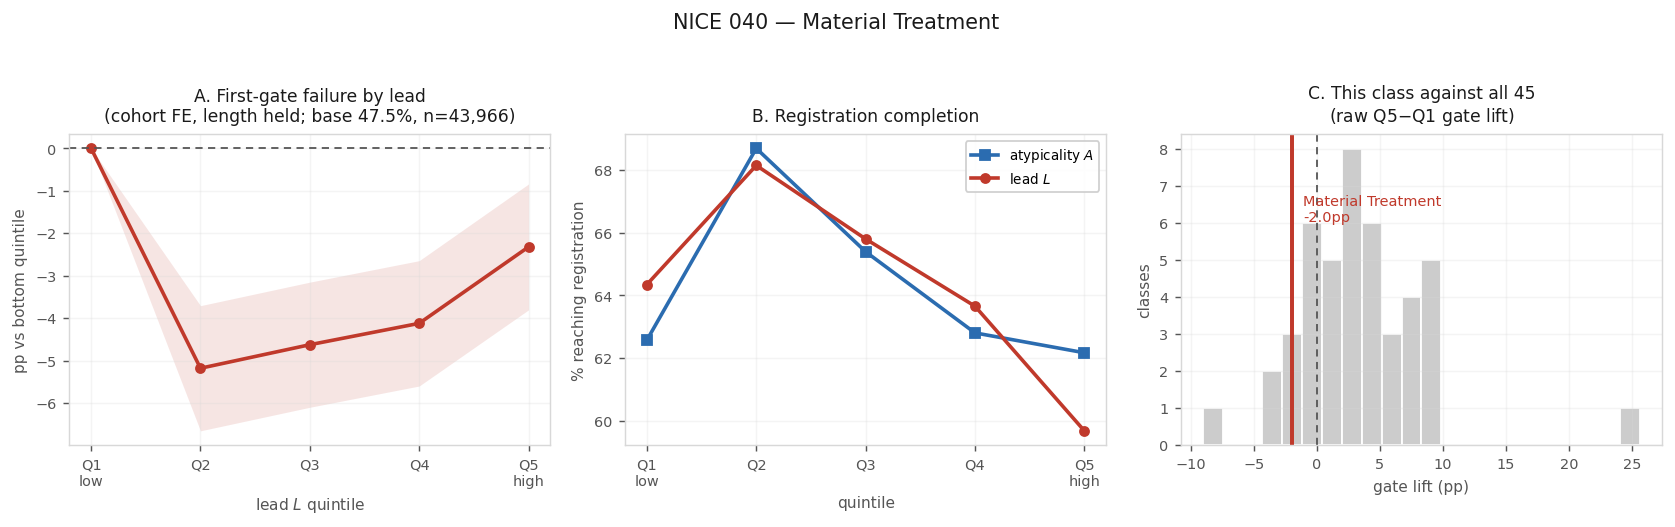
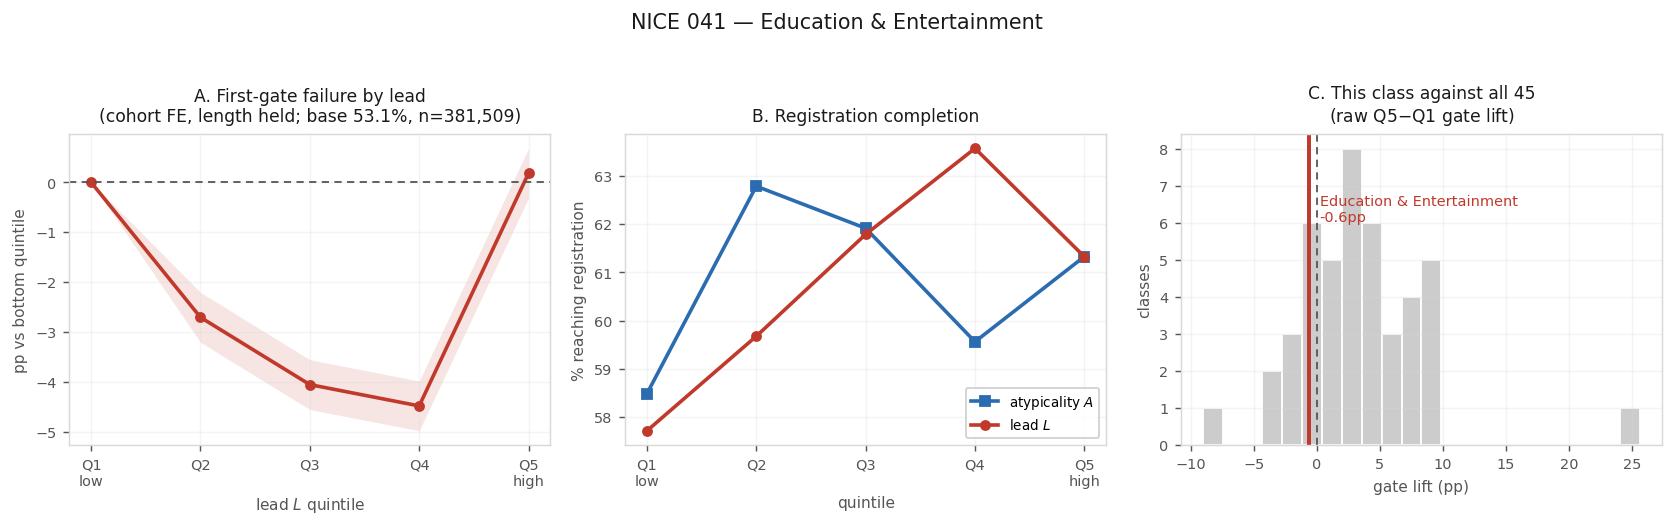
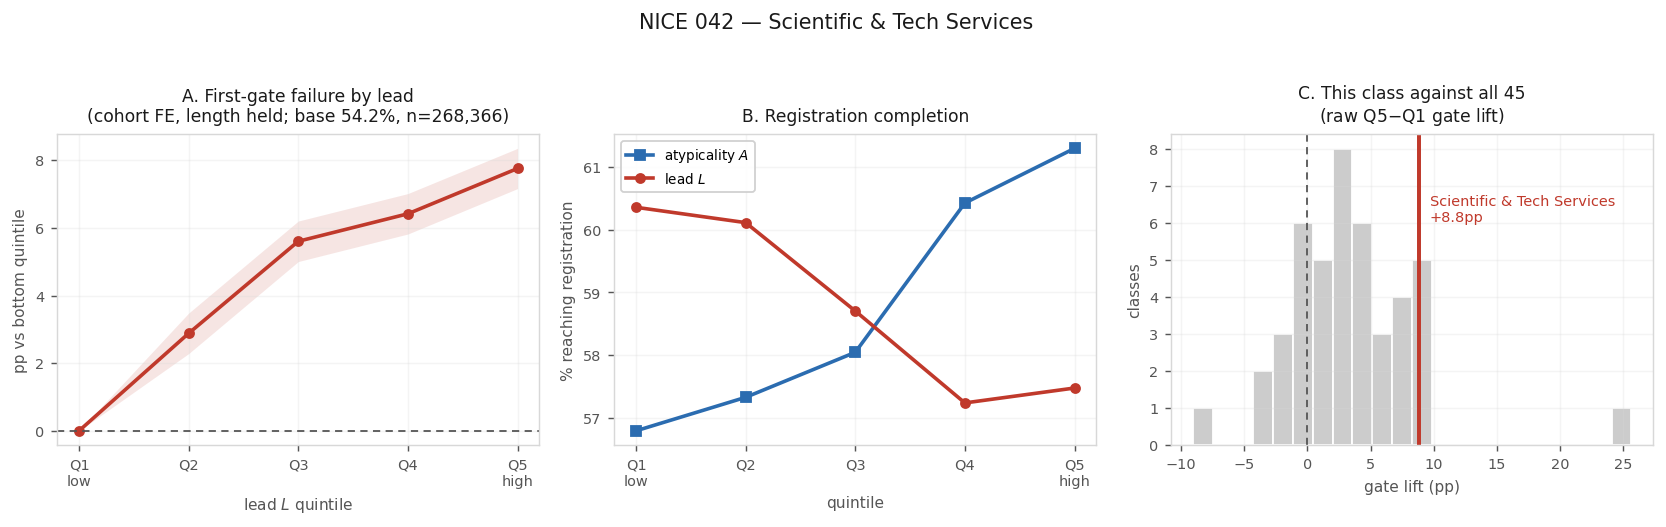
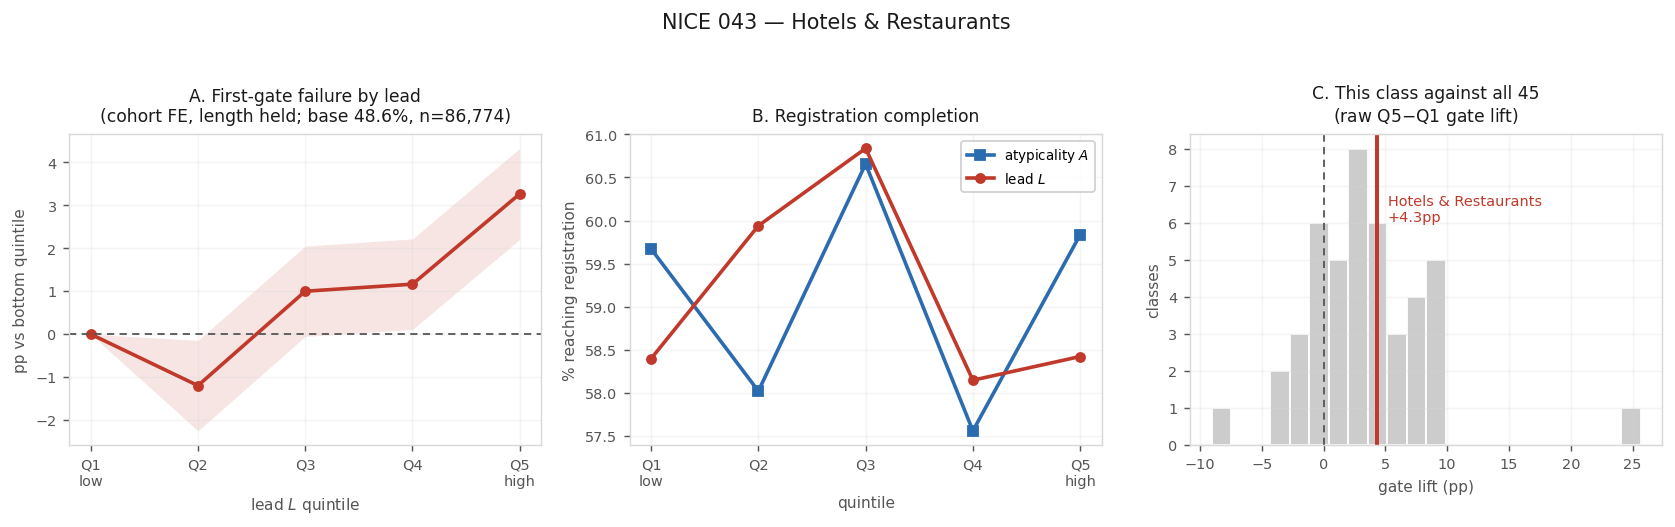
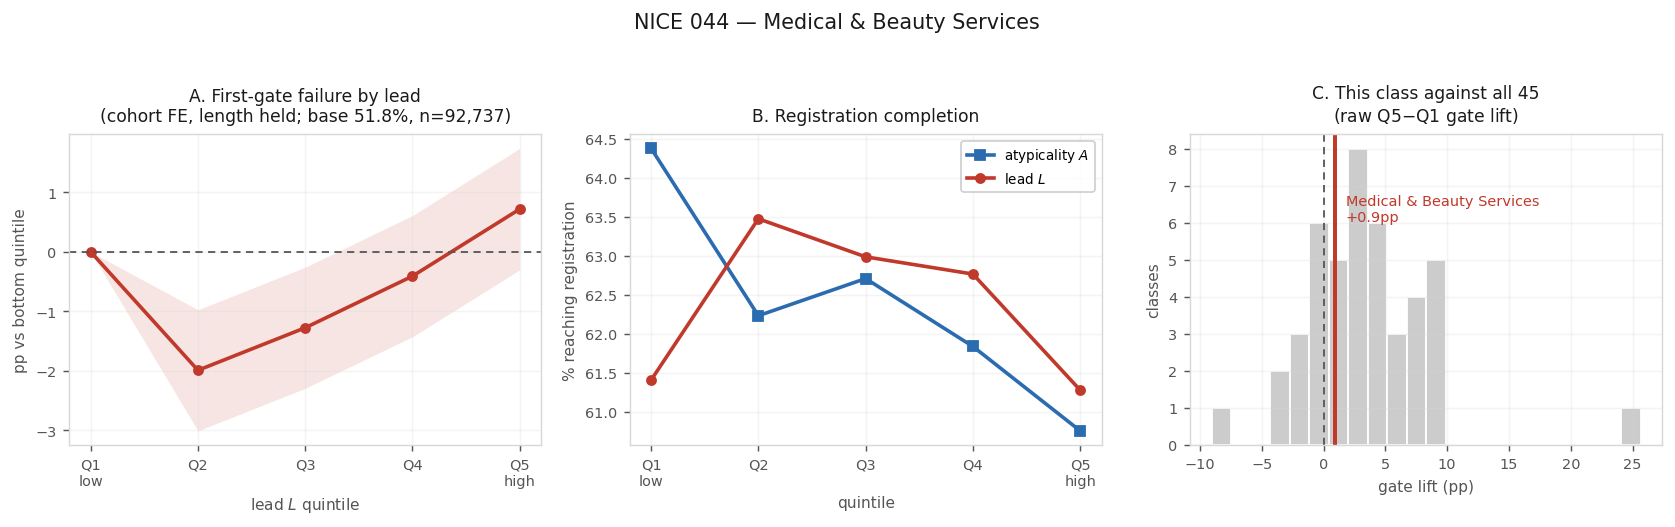
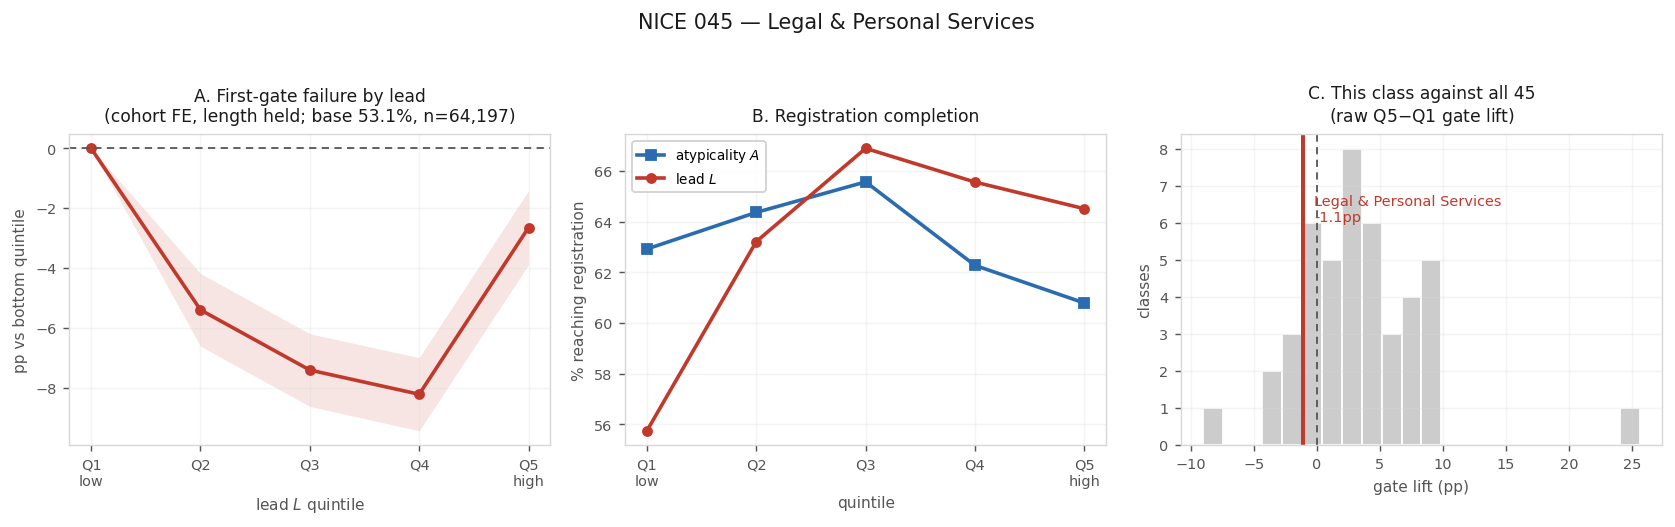
The gate contrast is top minus bottom lead quintile, in percentage points of failure at the five-year proof of continued use, not a per-quintile slope. Panel A of each class figure is a linear probability model with registration-cohort fixed effects and log description length held fixed, estimated within that class alone; panel B is raw completion rates by quintile; panel C places the class in the cross-industry distribution. Shaded bands and whiskers are 95% intervals.
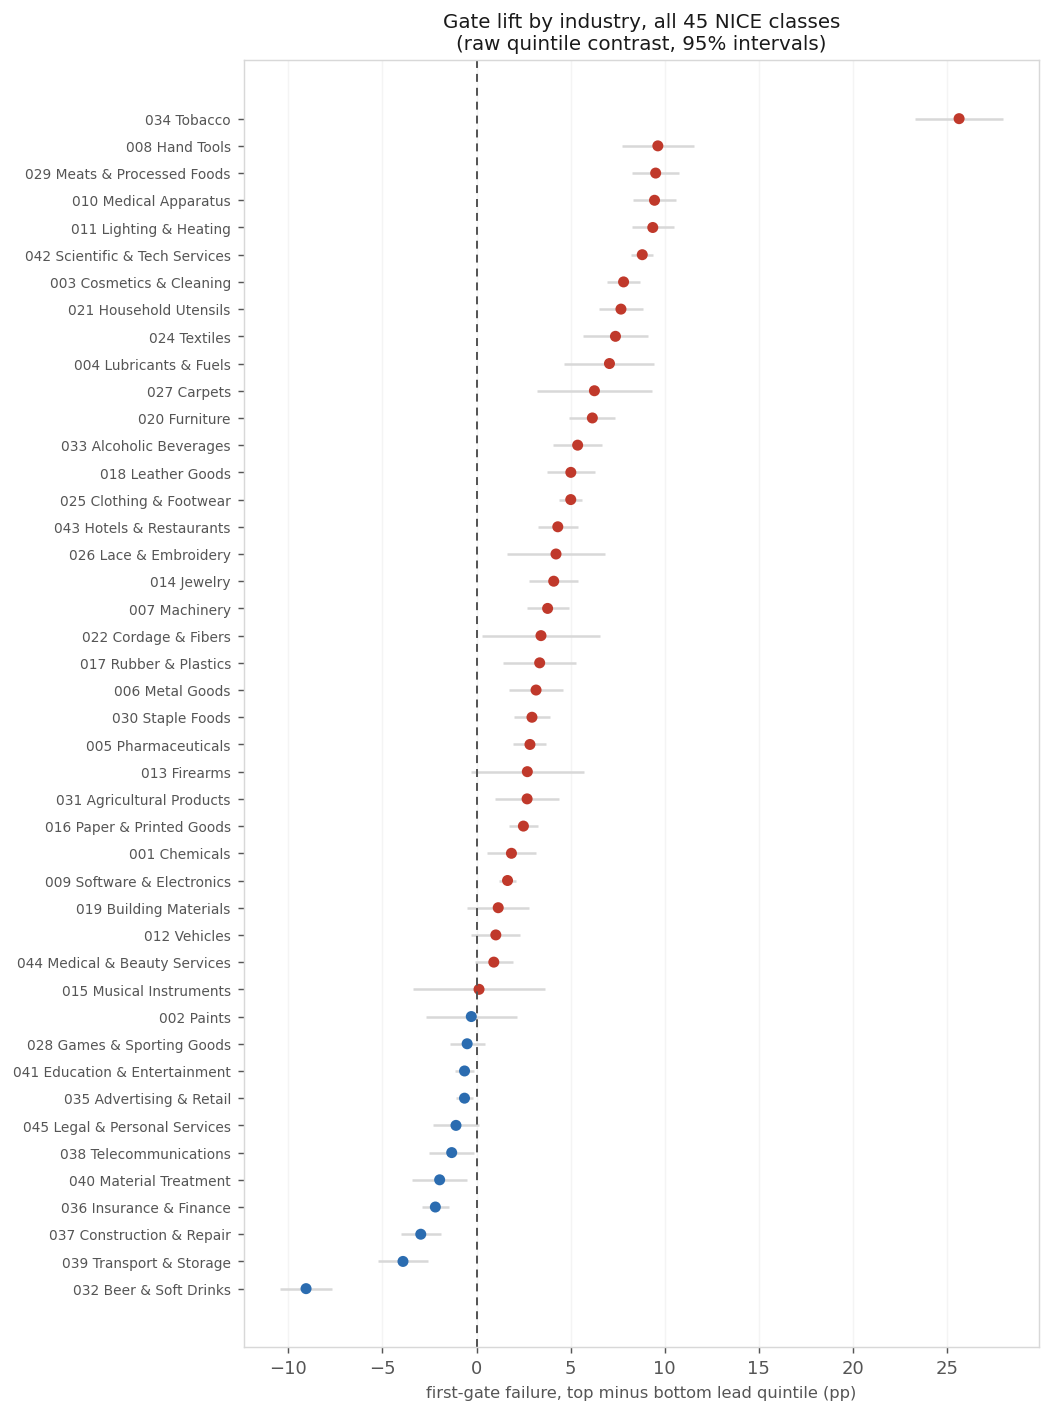
Per-class estimates are noisier than the pooled figure by construction, and small classes are noisy enough that individual signs should not be read as findings. The cross-industry exhibits below are the honest summary: 33 of 44 classes show a positive raw gate lift, and 32 of 44 do so under the cohort-fixed-effects specification, which is the claim the paper makes. The spread around it is what this appendix shows, and it is wide: the fixed-effects contrast runs from about −6pp to +19pp across classes.
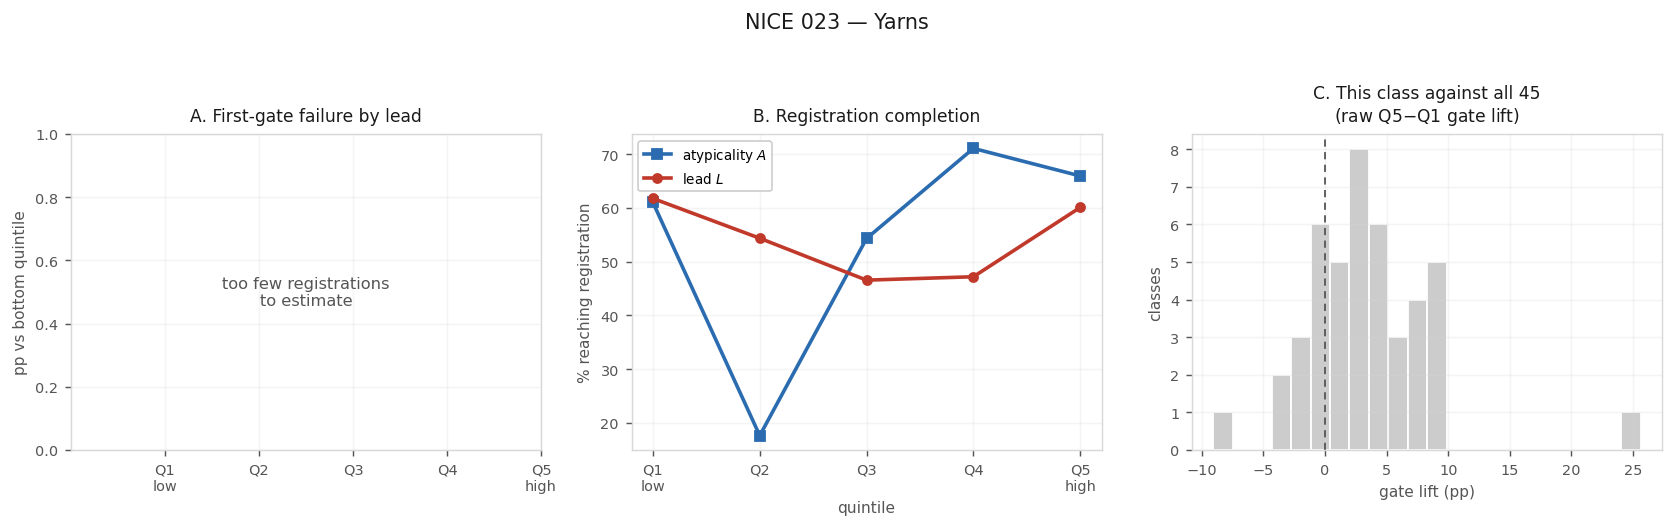
Nice 023 (yarns) falls below the volume floor the pooled analysis uses and has no raw entry; its figure is still generated.
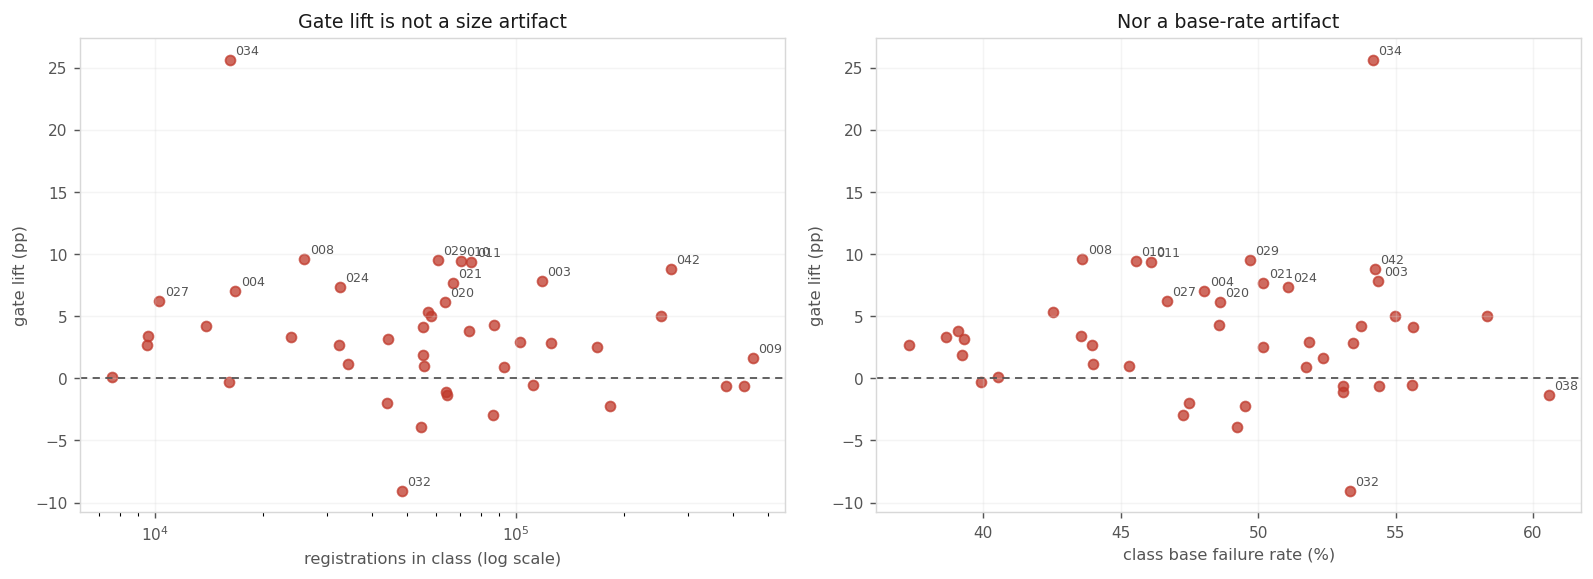
The scatter matters because the two obvious mechanical explanations for cross-class variation are class size (more registrations, tighter estimate, possibly different sign) and base failure rate (a class where most marks die has less room to move). Neither organises the variation.
Open the IPO viewer — every class’s registrations (1996–2018) as dots on the lead/atypicality plane, colored by the latest gate the record reaches: cancelled at the five-year proof of continued use, passed it, owner in SEC financial reporting, owner with an IPO marker. Later gates draw on top. Filter by Nice class and by registration year range.
per_class_estimates.csv — one row per class:
scored filings, registrations, base failure rate, raw and fixed-effects gate
contrasts with standard errors, and registration completion at both tails of
each axis.
Click a column heading to sort; click again to reverse. The Nice number links to that class’s figure below.
| Nice | Industry | Registrations | Base fail | Gate lift (raw) | Gate Q5, cohort FE |
|---|---|---|---|---|---|
| 1 | Chemicals | 55,166 | 39.2% | +1.9 ± 1.3 | +2.93 (0.66) |
| 2 | Paints | 16,070 | 39.9% | −0.3 ± 2.4 | −1.14 (1.24) |
| 3 | Cosmetics & Cleaning | 118,261 | 54.4% | +7.8 ± 0.9 | +7.32 (0.46) |
| 4 | Lubricants & Fuels | 16,708 | 48.0% | +7.1 ± 2.4 | +4.98 (1.22) |
| 5 | Pharmaceuticals | 124,888 | 53.4% | +2.8 ± 0.9 | +2.06 (0.45) |
| 6 | Metal Goods | 44,132 | 39.3% | +3.2 ± 1.4 | +2.80 (0.74) |
| 7 | Machinery | 74,433 | 39.1% | +3.8 ± 1.1 | +3.76 (0.57) |
| 8 | Hand Tools | 25,976 | 43.6% | +9.6 ± 1.9 | +7.89 (0.96) |
| 9 | Software & Electronics | 452,911 | 52.4% | +1.6 ± 0.5 | +3.28 (0.23) |
| 10 | Medical Apparatus | 70,401 | 45.5% | +9.5 ± 1.2 | +9.72 (0.59) |
| 11 | Lighting & Heating | 75,376 | 46.1% | +9.4 ± 1.1 | +7.52 (0.57) |
| 12 | Vehicles | 55,734 | 45.3% | +1.0 ± 1.3 | +0.39 (0.67) |
| 13 | Firearms | 9,516 | 37.3% | +2.7 ± 3.0 | −1.01 (1.56) |
| 14 | Jewelry | 55,321 | 55.6% | +4.1 ± 1.3 | +3.67 (0.67) |
| 15 | Musical Instruments | 7,622 | 40.5% | +0.1 ± 3.5 | −1.49 (1.78) |
| 16 | Paper & Printed Goods | 167,752 | 50.2% | +2.5 ± 0.8 | +1.40 (0.39) |
| 17 | Rubber & Plastics | 23,857 | 38.6% | +3.4 ± 2.0 | +2.81 (0.99) |
| 18 | Leather Goods | 58,194 | 55.0% | +5.0 ± 1.3 | +3.27 (0.66) |
| 19 | Building Materials | 34,332 | 44.0% | +1.1 ± 1.7 | +0.46 (0.85) |
| 20 | Furniture | 63,640 | 48.6% | +6.2 ± 1.2 | +3.35 (0.63) |
| 21 | Household Utensils | 66,993 | 50.2% | +7.7 ± 1.2 | +5.66 (0.61) |
| 22 | Cordage & Fibers | 9,556 | 43.5% | +3.4 ± 3.1 | +3.58 (1.60) |
| 23 | Yarns | 2,933 | — | — | — |
| 24 | Textiles | 32,519 | 51.1% | +7.4 ± 1.7 | +7.92 (0.88) |
| 25 | Clothing & Footwear | 252,116 | 58.3% | +5.0 ± 0.6 | +4.72 (0.31) |
| 26 | Lace & Embroidery | 13,857 | 53.8% | +4.2 ± 2.6 | +3.69 (1.34) |
| 27 | Carpets | 10,298 | 46.7% | +6.3 ± 3.0 | +6.18 (1.55) |
| 28 | Games & Sporting Goods | 111,839 | 55.6% | −0.5 ± 0.9 | −1.27 (0.47) |
| 29 | Meats & Processed Foods | 60,893 | 49.7% | +9.5 ± 1.3 | +9.15 (0.68) |
| 30 | Staple Foods | 102,594 | 51.9% | +2.9 ± 1.0 | +2.99 (0.51) |
| 31 | Agricultural Products | 32,292 | 43.9% | +2.7 ± 1.7 | +2.89 (0.87) |
| 32 | Beer & Soft Drinks | 48,341 | 53.3% | −9.1 ± 1.4 | −5.84 (0.72) |
| 33 | Alcoholic Beverages | 56,974 | 42.5% | +5.4 ± 1.3 | +1.32 (0.69) |
| 34 | Tobacco | 16,112 | 54.2% | +25.6 ± 2.3 | +19.03 (1.20) |
| 35 | Advertising & Retail | 428,569 | 54.4% | −0.6 ± 0.5 | −0.67 (0.24) |
| 36 | Insurance & Finance | 183,011 | 49.5% | −2.2 ± 0.7 | −0.58 (0.37) |
| 37 | Construction & Repair | 86,335 | 47.3% | −3.0 ± 1.1 | −3.15 (0.54) |
| 38 | Telecommunications | 64,322 | 60.6% | −1.3 ± 1.2 | −1.04 (0.61) |
| 39 | Transport & Storage | 54,593 | 49.2% | −3.9 ± 1.3 | −3.03 (0.68) |
| 40 | Material Treatment | 43,966 | 47.5% | −2.0 ± 1.5 | −2.32 (0.76) |
| 41 | Education & Entertainment | 381,509 | 53.1% | −0.6 ± 0.5 | +0.18 (0.25) |
| 42 | Scientific & Tech Services | 268,366 | 54.2% | +8.8 ± 0.6 | +7.76 (0.30) |
| 43 | Hotels & Restaurants | 86,774 | 48.6% | +4.3 ± 1.1 | +3.27 (0.54) |
| 44 | Medical & Beauty Services | 92,827 | 51.8% | +0.9 ± 1.0 | +0.72 (0.52) |
| 45 | Legal & Personal Services | 64,206 | 53.1% | −1.1 ± 1.2 | −2.65 (0.63) |